API Reference
Surfaces (maps)
RegularSurface
Functions
-
xtgeo.surface_from_file(mfile, fformat=None, template=None, values=True, engine='cxtgeo')[source]¶ Make an instance of a RegularSurface directly from file import.
- Parameters
mfile (str) – Name of file
fformat – File format, None/guess/irap_binary/irap_ascii/ijxyz/petromod/ zmap_ascii/xtg/hdf is currently supported. If None or guess, the file ‘signature’ is used to guess format first, then file extension.
template – Only valid if
ijxyzformat, where an existing Cube or RegularSurface instance is applied to get correct topology.values (bool) – If True (default), surface values will be read (Irap binary only)
engine (str) – Some import methods are implemnted in both C and Python. The C method
cxtgeois default. Alternative usepython
Example:
>>> import xtgeo
>>> mysurf = xtgeo.surface_from_file(surface_dir + '/topreek_rota.gri')
Changed in version 2.1: Key “values” for Irap binary maps added
Changed in version 2.13: Key “engine” added
-
xtgeo.surface_from_cube(cube, value)[source]¶ Make RegularSurface directly from a cube instance with a constant value.
The surface geometry will be exactly the same as for the Cube.
- Parameters
cube (xtgeo.cube.Cube) – A Cube instance
value (float) – A constant value for the surface
Example:
>>> import xtgeo
>>> mycube = xtgeo.cube_from_file(cube_dir + "/ib_test_cube2.segy")
>>> mymap = xtgeo.surface_from_cube(mycube, 2700)
-
xtgeo.surface_from_grid3d(grid, template=None, where='top', mode='depth', rfactor=1)[source]¶ This makes 3 instances of a RegularSurface directly from a Grid() instance.
- Parameters
grid (Grid) – XTGeo Grid instance
template (RegularSurface) – Optional to use an existing surface as template for geometry
where (str) – “top”, “base” or use the syntax “2_top” where 2 is layer no. 2 and _top indicates top of cell, while “_base” indicates base of cell
mode (str) – “depth”, “i” or “j”
rfactor (float) – Determines how fine the extracted map is; higher values for finer map (but computing time will increase). Will only apply if template is None.
New in version 2.1.
-
xtgeo.surface_from_roxar(project, name, category, stype='horizons', realisation=0)[source]¶ This makes an instance of a RegularSurface directly from roxar input.
- Parameters
project (str or special) – Name of project (as folder) if outside RMS, og just use the magic project word if within RMS.
name (str) – Name of surface/map
category (str) – For horizons/zones or clipboard/general2d_data: for example ‘DS_extracted’. For clipboard/general2d_data this can be empty or None, or use ‘/’ for multiple folder levels (e.g. ‘fld/subfld’). For ‘trends’, the category is not applied.
stype (str) – RMS folder type, ‘horizons’ (default), ‘zones’, ‘clipboard’, ‘general2d_data’ or ‘trends’
realisation (int) – Realisation number, default is 0
Example:
# inside RMS:
import xtgeo
mysurf = xtgeo.surface_from_roxar(project, 'TopEtive', 'DepthSurface')
Note:
When dealing with surfaces to and from ``stype="trends"``, the surface must
exist in advance, i.e. the Roxar API do not allow creating new surfaces.
Actually trends are read only, but a workaround using ``load()`` in Roxar
API makes it possible to overwrite existing surface trends. In addition,
``realisation`` is not applied in trends.
Classes
-
class
xtgeo.RegularSurface(ncol, nrow, xinc, yinc, xori=0.0, yori=0.0, yflip=1, rotation=0.0, values=None, ilines=None, xlines=None, masked=True, name='unknown', filesrc=None, fformat=None, undef=1e+33)[source]¶ Bases:
objectClass for a regular surface in the XTGeo framework.
The values can as default be accessed by the user as a 2D masked numpy (ncol, nrow) float64 array, but also other representations or views are possible (e.g. as 1D ordinary numpy).
Instantiating a RegularSurface:
vals = np.zeros(30 * 50)
surf = xtgeo.RegularSurface(
    ncol=30, nrow=50, xori=1234.5, yori=4321.0, xinc=30.0, yinc=50.0,
    rotation=30.0, values=vals, yflip=1,
)
- Parameters
ncol (
int) – Integer for number of X direction columns.nrow (
int) – Integer for number of Y direction rows.xori (
Optional[float]) – X (East) origon coordinate.yori (
Optional[float]) – Y (North) origin coordinate.xinc (
float) – X increment.yinc (
float) – Y increment.yflip (
Optional[int]) – If 1, the map grid is left-handed (assuming depth downwards), otherwise -1 means that Y axis is flipped (right-handed).rotation (
Optional[float]) – rotation in degrees, anticlock from X axis between 0, 360.values (
Union[List[float],float,None]) – A scalar (for constant values) or a “array-like” input that has ncol * nrow elements. As result, a 2D (masked) numpy array of shape (ncol, nrow), C order will be made.masked (
Optional[bool]) – Indicating if numpy array shall be masked or not. Default is True.name (
Optional[str]) – A given name for the surface, default is file name root or ‘unknown’ if constructed from scratch.ilines (Optional[List[float], None]) –
xlines (Optional[List[float], None]) –
filesrc (Optional[str, None]) –
fformat (Optional[str, None]) –
undef (Optional[float, None]) –
Examples
The instance can be made by specification:
>>> surface = RegularSurface(
... ncol=20,
... nrow=10,
... xori=2000.0,
... yori=2000.0,
... rotation=0.0,
... xinc=25.0,
... yinc=25.0,
... values=np.zeros((20,10))
... )
Public Data Attributes:
metadataReturn metadata object instance of type MetaDataRegularSurface.
ncolThe NCOL (NX or N-Idir) number, as property (read only).
nrowThe NROW (NY or N-Jdir) number, as property (read only).
dimensionsThe surface dimensions as a tuple of 2 integers (read only).
nactiveNumber of active map nodes (read only).
rotationThe rotation, anticlock from X axis, in degrees [0..360>.
xincThe X increment (or I dir increment).
yincThe Y increment (or I dir increment).
yflipThe Y flip (handedness) indicator 1, or -1 (read only).
xoriThe X coordinate origin of the map.
yoriThe Y coordinate origin of the map.
ilinesThe inlines numbering vector (read only).
xlinesThe xlines numbering vector (read only).
xminThe minimim X coordinate (read only).
xmaxThe maximum X coordinate (read only).
yminThe minimim Y coordinate (read only).
ymaxThe maximum Y xoordinate (read only).
valuesThe map values, as 2D masked numpy (float64), shape (ncol, nrow).
values1d(Read only) Map values, as 1D numpy masked, normally a numpy view(?).
npvalues1d(Read only) Map values, as 1D numpy (not masked), undef as np.nan.
nameA free form name for the surface, to be used in display etc.
undefReturns the undef map value (read only).
undef_limitReturns the undef_limit map value (read only).
filesrcGives the name of the file source (if any).
Public Methods:
methods()Returns the names of the methods in the class.
generate_hash([hashmethod])Return a unique hash ID for current instance.
describe([flush])Describe an instance by printing to stdout.
from_file(mfile[, fformat, values])Import surface (regular map) from file.
load_values()Import surface values in cases where metadata only is loaded.
to_file(mfile[, fformat, pmd_dataunits, engine])Export a surface (map) to file.
from_hdf(mfile[, values])Import/load a surface (map) with metadata from a HDF5 file.
to_hdf(mfile[, compression])Export a surface (map) with metadata to a HDF5 file.
from_roxar(project, name, category[, stype, …])Load a surface from a Roxar RMS project.
to_roxar(project, name, category[, stype, …])Store (export) a regular surface to a Roxar RMS project.
from_cube(cube, zlevel)Make a constant surface from a Cube, at a given time/depth level.
from_grid3d(grid[, template, where, mode, …])Extract a surface from a 3D grid.
copy()Deep copy of a RegularSurface object to another instance.
get_values1d([order, asmasked, fill_value, …])Get a 1D numpy or masked array of the map values.
set_values1d(val[, order])Update the values attribute based on a 1D input, multiple options.
get_rotation()Returns the surface roation, in degrees, from X, anti-clock.
get_nx()Same as ncol (nx) (for backward compatibility).
get_ny()Same as nrow (ny) (for backward compatibility).
get_xori()Same as property xori (for backward compatibility).
get_yori()Same as property yori (for backward compatibility).
get_xinc()Same as property xinc (for backward compatibility).
get_yinc()Same as property yinc (for backward compatibility).
similarity_index(other)Report the degree of similarity between two maps, by comparing mean.
compare_topology(other[, strict])Check that two object has the same topology, i.e. map definitions.
swapaxes()Swap (flip) the axes columns vs rows, keep origin but reverse yflip.
get_map_xycorners()Get the X and Y coordinates of the map corners.
get_value_from_xy([point, sampling])Return the map value given a X Y point.
get_xy_value_from_ij(iloc, jloc[, zvalues])Returns x, y, z(value) from a single i j location.
get_ij_values([zero_based, asmasked, order])Return I J numpy 2D arrays, optionally as masked arrays.
get_ij_values1d([zero_based, activeonly, order])Return I J numpy as 1D arrays.
get_xy_values([order, asmasked])Return coordinates for X and Y as numpy (masked) 2D arrays.
get_xy_values1d([order, activeonly])Return coordinates for X and Y as numpy 1D arrays.
get_xyz_values()Return coordinates for X Y and Z (values) as numpy (masked) 2D arrays.
get_xyz_values1d([order, activeonly, fill_value])Return coordinates for X Y and Z (values) as numpy 1D arrays.
get_dataframe([ijcolumns, ij, order, …])Return a Pandas dataframe object, with columns X_UTME, Y_UTMN, VALUES.
dataframe([ijcolumns, ij, order, …])Return a Pandas dataframe object, with columns X_UTME, Y_UTMN, VALUES.
get_xy_value_lists([lformat, xyfmt, valuefmt])Returns two lists for coordinates (x, y) and values.
autocrop()Automatic cropping of the surface to minimize undefined areas.
fill([fill_value])Fast infilling of undefined values.
smooth([method, iterations, width])Various smoothing methods for surfaces.
operation(opname, value)Do operation on map values.
operation_polygons(poly, value[, opname, inside])A generic function for map operations inside or outside polygon(s).
add_inside(poly, value)Add a value (scalar or other map) inside polygons.
add_outside(poly, value)Add a value (scalar or other map) outside polygons.
sub_inside(poly, value)Subtract a value (scalar or other map) inside polygons.
sub_outside(poly, value)Subtract a value (scalar or other map) outside polygons.
mul_inside(poly, value)Multiply a value (scalar or other map) inside polygons.
mul_outside(poly, value)Multiply a value (scalar or other map) outside polygons.
div_inside(poly, value)Divide a value (scalar or other map) inside polygons.
div_outside(poly, value)Divide a value (scalar or other map) outside polygons.
set_inside(poly, value)Set a value (scalar or other map) inside polygons.
set_outside(poly, value)Set a value (scalar or other map) outside polygons.
eli_inside(poly)Eliminate current map values inside polygons.
eli_outside(poly)Eliminate current map values outside polygons.
add(other)Add another map to current map.
subtract(other)Subtract another map from current map.
multiply(other)Multiply another map and current map.
divide(other)Divide current map with another map.
gridding(points[, method, coarsen])Grid a surface from points.
resample(other[, mask, sampling])Resample an instance surface values from another surface instance.
unrotate([factor])Unrotete a map instance, and this will also change nrow, ncol, xinc, etc.
refine(factor)Refine a surface with a factor.
coarsen(factor)Coarsen a surface with a factor.
slice_grid3d(grid, prop[, zsurf, sbuffer])Slice the grid property and update the instance surface to sampled values.
slice_cube(cube[, zsurf, sampling, mask, …])Slice the cube and update the instance surface to sampled cube values.
slice_cube_window(cube[, zsurf, other, …])Slice the cube within a vertical window and get the statistical attrubutes.
get_boundary_polygons([alpha_factor, …])Extract boundary polygons from the surface.
get_fence(xyfence[, sampling])Sample the surface along X and Y positions (numpy arrays) and get Z.
get_randomline(fencespec[, hincrement, …])Extract a line along a fencespec.
hc_thickness_from_3dprops([xprop, yprop, …])Make a thickness weighted HC thickness map.
avg_from_3dprop([xprop, yprop, mprop, …])Average map (DZ weighted) based on numpy arrays of properties from a 3D grid.
quickplot([filename, title, subtitle, …])Fast surface plot of maps using matplotlib.
distance_from_point([point, azimuth])Make map values as horizontal distance from a point with azimuth direction.
translate_coordinates([translate])Translate a map in X Y VALUE space.
-
__init__(ncol, nrow, xinc, yinc, xori=0.0, yori=0.0, yflip=1, rotation=0.0, values=None, ilines=None, xlines=None, masked=True, name='unknown', filesrc=None, fformat=None, undef=1e+33)[source]¶ Instantiating a RegularSurface:
vals = np.zeros(30 * 50)
surf = xtgeo.RegularSurface(
    ncol=30, nrow=50, xori=1234.5, yori=4321.0, xinc=30.0, yinc=50.0,
    rotation=30.0, values=vals, yflip=1,
)
- Parameters
ncol (
int) – Integer for number of X direction columns.nrow (
int) – Integer for number of Y direction rows.xori (
Optional[float]) – X (East) origon coordinate.yori (
Optional[float]) – Y (North) origin coordinate.xinc (
float) – X increment.yinc (
float) – Y increment.yflip (
Optional[int]) – If 1, the map grid is left-handed (assuming depth downwards), otherwise -1 means that Y axis is flipped (right-handed).rotation (
Optional[float]) – rotation in degrees, anticlock from X axis between 0, 360.values (
Union[List[float],float,None]) – A scalar (for constant values) or a “array-like” input that has ncol * nrow elements. As result, a 2D (masked) numpy array of shape (ncol, nrow), C order will be made.masked (
Optional[bool]) – Indicating if numpy array shall be masked or not. Default is True.name (
Optional[str]) – A given name for the surface, default is file name root or ‘unknown’ if constructed from scratch.ilines (Optional[List[float], None]) –
xlines (Optional[List[float], None]) –
filesrc (Optional[str, None]) –
fformat (Optional[str, None]) –
undef (Optional[float, None]) –
Examples
The instance can be made by specification:
>>> surface = RegularSurface(
... ncol=20,
... nrow=10,
... xori=2000.0,
... yori=2000.0,
... rotation=0.0,
... xinc=25.0,
... yinc=25.0,
... values=np.zeros((20,10))
... )
-
autocrop()[source]¶ Automatic cropping of the surface to minimize undefined areas.
This method is simply removing undefined “white areas”. The instance will be updated with new values for xori, yori, ncol, etc. Rotation will never change
- Returns
RegularSurface instance is updated in-place
New in version 2.12.
-
avg_from_3dprop(xprop=None, yprop=None, mprop=None, dzprop=None, truncate_le=None, zoneprop=None, zone_minmax=None, coarsen=1, zone_avg=False)[source]¶ Average map (DZ weighted) based on numpy arrays of properties from a 3D grid.
The 3D arrays mush be ordinary numpies of size (nx,ny,nz). Undef entries must be given weights 0 by using DZ=0
- Parameters
xprop – 3D numpy of all X coordinates (also inactive cells)
yprop – 3D numpy of all Y coordinates (also inactive cells)
mprop – 3D numpy of requested property (e.g. porosity) all
dzprop – 3D numpy of dz values (for weighting) NB zero for undef cells
truncate_le (float) – Optional. Truncate value (mask) if value is less
zoneprop – 3D numpy to a zone property
zone_minmax – a tuple with from-to zones to combine (e.g. (1,3))
- Returns
Nothing explicit, but updates the surface object.
-
coarsen(factor)[source]¶ Coarsen a surface with a factor.
Range for coarsening is 2 to 10, where e.g. 2 meaning half the number of columns and rows.
Note that there may be some ‘loss’ of nodes at the edges of the updated map, as only the ‘inside’ nodes in the updated map versus the input map are applied.
- Parameters
factor (int) – Coarsen factor (2 .. 10)
- Raises
ValueError – Coarsen is too large, giving too few nodes in result
-
compare_topology(other, strict=True)[source]¶ Check that two object has the same topology, i.e. map definitions.
Map definitions such as origin, dimensions, number of defined cells…
- Parameters
other (surface object) – The other surface to compare with
strict (bool) – If false, the masks are not compared
- Returns
True of same topology, False if not
-
copy()[source]¶ Deep copy of a RegularSurface object to another instance.
Example:
>>> mymap = xtgeo.surface_from_file(surface_dir + '/topreek_rota.gri')
>>> mymapcopy = mymap.copy()
-
dataframe(ijcolumns=False, ij=False, order='C', activeonly=True, fill_value=nan)¶ Return a Pandas dataframe object, with columns X_UTME, Y_UTMN, VALUES.
- Parameters
ijcolumns (bool) – If True, and IX and JY indices will be added as dataframe columns. Redundant, use “ij” instead.
ij (bool) – Same as ijcolumns. If True, and IX and JY indices will be added as dataframe columns. Preferred syntax
order (str) – ‘C’ (default) for C order (row fastest), or ‘F’ for Fortran order (column fastest)
activeonly (bool) – If True, only active nodes are listed. If False, the values will have fill_value default None = NaN as values
fill_value (float) – Value of inactive nodes if activeonly is False
Example:
>>> import xtgeo
>>> surf = xtgeo.surface_from_file(surface_dir + '/topreek_rota.gri')
>>> dfr = surf.get_dataframe()
>>> dfr.to_csv('somecsv.csv')
- Returns
A Pandas dataframe object.
-
property
dimensions¶ The surface dimensions as a tuple of 2 integers (read only).
- Type
2-tuple
-
distance_from_point(point=(0, 0), azimuth=0.0)[source]¶ Make map values as horizontal distance from a point with azimuth direction.
- Parameters
point (tuple) – Point to measure from
azimuth (float) – Angle from North (clockwise) in degrees
-
property
filesrc¶ Gives the name of the file source (if any).
-
fill(fill_value=None)[source]¶ Fast infilling of undefined values.
Note that minimum and maximum values will not change.
Algorithm if fill_value is not set is based on a nearest node extrapolation. Technically,
scipy.ndimage.distance_transform_edtis applied. If fill_value is set by a scalar, that (constant) value be be applied- Parameters
fill_value (float) – If defined, fills all undefined cells with that value.
- Returns
RegularSurface instance is updated in-place
New in version 2.1.
Changed in version 2.6: Added option key fill_value
-
from_cube(cube, zlevel)[source]¶ Make a constant surface from a Cube, at a given time/depth level.
The surface instance will have exactly the same origins and increments as the cube.
- Parameters
cube (Cube) – XTGeo Cube instance
zlevel (float) – Depth or Time (or whatever) value of the surface
- Returns
Object instance updated
Example
Here the from_roxar method is used to initiate the object directly:
>>> import xtgeo
>>> mycube = xtgeo.cube_from_file(cube_dir + "/ib_test_cube2.segy")
>>> mymap = xtgeo.RegularSurface()
>>> mymap.from_cube(mycube, 2700)
Deprecated since version 2.15: This will be removed in 4.0. Use xtgeo.surface.surface_from_cube() instead
-
from_file(mfile, fformat=None, values=True, **kwargs)[source]¶ Import surface (regular map) from file.
Note that the
fformat=Noneorguessoption will guess format by looking at the file or stream signature or file extension. For the signature, the first bytes are scanned for ‘patterns’. If that does not work (and input is not a memory stream), it will try to use file extension where e.g. “gri” will assume irap_binary and “fgr” assume Irap Ascii. If file extension is missing, Irap binary is assumed.The
ijxyzformat is the typical seismic format, on the form (ILINE, XLINE, X, Y, VALUE) as a table of points. Map values are estimated from the given values, or by using an existing map or cube as template, and match by ILINE/XLINE numbering.BytesIO input is supported for Irap binary, Irap Ascii, ZMAP ascii.
- Parameters
mfile (
Union[str,Path,BytesIO]) – File-like or memory stream instance.fformat (
Optional[str]) – File format, None/guess/irap_binary/irap_ascii/ijxyz is currently supported. If None or guess, the file ‘signature’ is used to guess format first, then file extension.values (
Optional[bool]) – If True (default), then full array is read, if False only metadata will be read. Valid for Irap binary only. This allows lazy loading in e.g. ensembles.kwargs – some readers allow additonal options:
template – Only valid if
ijxyzformat, where an existing Cube or RegularSurface instance is applied to get correct topology.engine – Default is “cxtgeo” which use a C backend. Optionally a pure python “python” reader will be used, which in general is slower but may be safer when reading memory streams and/or threading. Engine is relevant for Irap binary, Irap ascii and zmap.
- Returns
Object instance.
Example
Here the from_file method is used to initiate the object directly:
>>> surf = RegularSurface().from_file(surface_dir + "/topreek_rota.gri")
Changed in version 2.1: Key “values” for Irap binary maps added
Changed in version 2.2: Input io.BytesIO instance instead of file is now possible
Changed in version 2.13: ZMAP + import is added, and io.BytesIO input is extended to more formats
Deprecated since version 2.15: This will be removed in 4.0. Use xtgeo.surface_from_file() instead
-
from_grid3d(grid, template=None, where='top', mode='depth', rfactor=1)[source]¶ Extract a surface from a 3D grid.
- Parameters
grid (Grid) – XTGeo Grid instance
template (RegularSurface) – Optional to use an existing surface as template for geometry
where (str) – “top”, “base” or use the syntax “2_top” where 2 is layer no. 2 and _top indicates top of cell, while “_base” indicates base of cell
mode (str) – “depth”, “i” or “j”
rfactor (float) – Determines how fine the extracted map is; higher values for finer map (but computing time will increase). Will only apply if template is None.
- Returns
Object instance is updated in-place When mode=”depth”, two RegularSurface: icols and jrows are also returned.
Example:
>>> import xtgeo
>>> mymap = RegularSurface()
>>> mygrid = xtgeo.grid_from_file(reek_dir + "/REEK.EGRID")
>>> # return two additonal maps
>>> ic, jr = mymap.from_grid3d(mygrid)
New in version 2.1.
Deprecated since version 2.15: This will be removed in 4.0. Use xtgeo.surface_from_grid3d() instead
-
from_hdf(mfile, values=True)[source]¶ Import/load a surface (map) with metadata from a HDF5 file.
Warning
This implementation is currently experimental and only recommended for testing.
The file extension shall be ‘.hdf’.
- Parameters
mfile (
Union[str,Path,BytesIO]) – File name or Path object or memory streamvalues (
Optional[bool]) – If False, only metadatadata are read
- Returns
RegularSurface() instance
Example
>>> import xtgeo
>>> surf = xtgeo.surface_from_file(surface_dir + '/topreek_rota.gri')
>>> filepath = surf.to_hdf(outdir + "/topreek_rota.hdf")
>>> mysurf = xtgeo.RegularSurface().from_hdf(filepath)
New in version 2.14.
Deprecated since version 2.15: This will be removed in 4.0. Use xtgeo.surface_from_hdf() instead
-
from_roxar(project, name, category, stype='horizons', realisation=0)[source]¶ Load a surface from a Roxar RMS project.
The import from the RMS project can be done either within the project or outside the project.
Note that a shortform to:
import xtgeo
mysurf = xtgeo.surface.RegularSurface()
mysurf.from_roxar(project, 'TopAare', 'DepthSurface')
is:
import xtgeo
mysurf = xtgeo.surface_from_roxar(project, 'TopAare', 'DepthSurface')
Note also that horizon/zone name and category must exists in advance, otherwise an Exception will be raised.
- Parameters
project (str or special) – Name of project (as folder) if outside RMS, og just use the magic project word if within RMS.
name (str) – Name of surface/map
category (str) – For horizons/zones or clipboard/general2d_data: for example ‘DS_extracted’
stype (str) – RMS folder type, ‘horizons’ (default), ‘zones’, ‘clipboard’ or ‘general2d_data’
realisation (int) – Realisation number, default is 0
- Returns
Object instance updated
- Raises
ValueError – Various types of invalid inputs.
Example
Here the from_roxar method is used to initiate the object directly:
mymap = RegularSurface()
mymap.from_roxar(project, 'TopAare', 'DepthSurface')
Deprecated since version 2.15: This will be removed in 4.0. Use xtgeo.surface_from_roxar() instead
-
generate_hash(hashmethod='md5')[source]¶ Return a unique hash ID for current instance.
See
generic_hash()for documentation.New in version 2.14.
-
get_boundary_polygons(alpha_factor=1.0, convex=False, simplify=True)[source]¶ Extract boundary polygons from the surface.
A regular surface may often contain areas of undefined (masked) entries which makes the surface appear ‘ragged’ and/or ‘patchy’.
This method extracts boundaries around the surface patches, and the precision depends on the keyword settings. As default, the
alpha_factorof 1 makes a precise boundary, while a larger alpha_factor makes more rough polygons.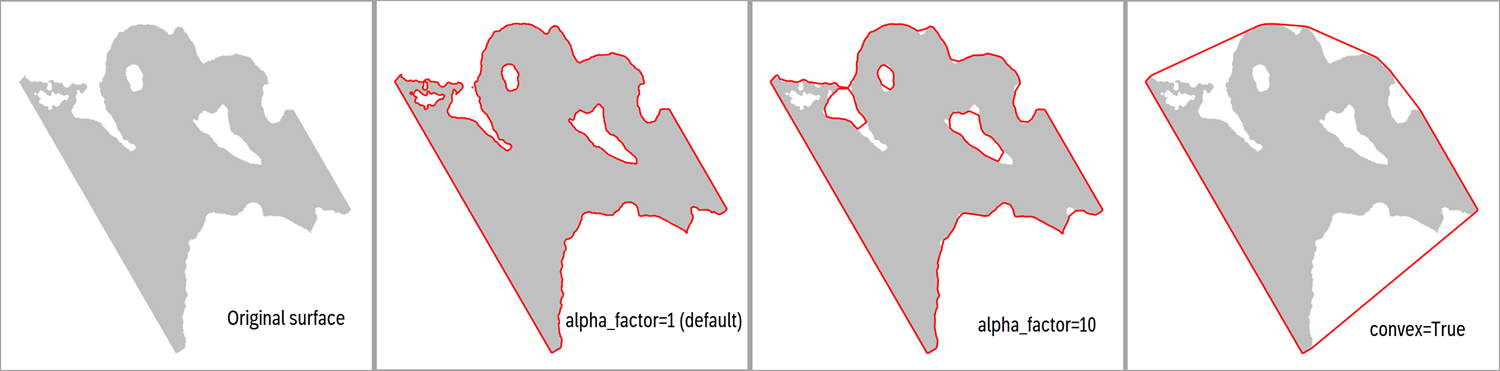
- Parameters
alpha_factor (
Optional[float]) – An alpha multiplier, where lowest allowed value is 1.0. A higher number will produce smoother and less accurate polygons. Not applied if convex is set to True.convex (
Optional[bool]) – The default is False, which means that a “concave hull” algorithm is used. If convex is True, the alpha factor is overridden to a large number, producing a ‘convex’ shape boundary instead.simplify (
Optional[bool]) – If True, a simplification is done in order to reduce the number of points in the polygons, where tolerance is 0.1. Another alternative to True is to input a Dict on the form{"tolerance": 2.0, "preserve_topology": True}, cf. thePolygons.simplify()method. For details on e.g. tolerance, see Shapely’s simplify() method.
- Returns
A XTGeo Polygons instance
Example:
surf = xtgeo.surface_from_file("mytop.gri")
# eliminate all values below a depth, e.g. a fluid contact
surf.values = np.ma.masked_greater(surf.values, 2100.0)
boundary = surf.get_boundary_polygons()
# the boundary may contain several smaller polygons; keep only the
# largest (first) polygon which is number 0:
boundary.filter_byid([0])  # polygon is updated in-place
See also
The
Polygons.boundary_from_points()class method.New in version 3.1.
-
get_dataframe(ijcolumns=False, ij=False, order='C', activeonly=True, fill_value=nan)[source]¶ Return a Pandas dataframe object, with columns X_UTME, Y_UTMN, VALUES.
- Parameters
ijcolumns (bool) – If True, and IX and JY indices will be added as dataframe columns. Redundant, use “ij” instead.
ij (bool) – Same as ijcolumns. If True, and IX and JY indices will be added as dataframe columns. Preferred syntax
order (str) – ‘C’ (default) for C order (row fastest), or ‘F’ for Fortran order (column fastest)
activeonly (bool) – If True, only active nodes are listed. If False, the values will have fill_value default None = NaN as values
fill_value (float) – Value of inactive nodes if activeonly is False
Example:
>>> import xtgeo
>>> surf = xtgeo.surface_from_file(surface_dir + '/topreek_rota.gri')
>>> dfr = surf.get_dataframe()
>>> dfr.to_csv('somecsv.csv')
- Returns
A Pandas dataframe object.
-
get_fence(xyfence, sampling='bilinear')[source]¶ Sample the surface along X and Y positions (numpy arrays) and get Z.
Changed in version 2.14: Added keyword option sampling
Returns a masked numpy 2D array similar as input, but with updated Z values, which are masked if undefined.
- Parameters
xyfence (
ndarray) – A 2D numpy array with shape (N, 3) where columns are (X, Y, Z). The Z will be updated to the map.sampling (
Optional[str]) – Use “bilinear” (default) for interpolation or “nearest” for snapping to nearest node.
- Return type
MaskedArray
-
get_ij_values(zero_based=False, asmasked=False, order='C')[source]¶ Return I J numpy 2D arrays, optionally as masked arrays.
- Parameters
zero_based (bool) – If False, first number is 1, not 0
asmasked (bool) – If True, UNDEF map nodes are skipped
order (str) – ‘C’ (default) or ‘F’ order (row vs column major)
-
get_ij_values1d(zero_based=False, activeonly=True, order='C')[source]¶ Return I J numpy as 1D arrays.
- Parameters
zero_based (bool) – If False, first number is 1, not 0
activeonly (bool) – If True, UNDEF map nodes are skipped
order (str) – ‘C’ (default) or ‘F’ order (row vs column major)
-
get_map_xycorners()[source]¶ Get the X and Y coordinates of the map corners.
Returns a tuple on the form ((x0, y0), (x1, y1), (x2, y2), (x3, y3)) where (if unrotated and normal flip) 0 is the lower left corner, 1 is the right, 2 is the upper left, 3 is the upper right.
-
get_randomline(fencespec, hincrement=None, atleast=5, nextend=2, sampling='bilinear')[source]¶ Extract a line along a fencespec.
New in version 2.1.
Changed in version 2.14: Added keyword option sampling
Here, horizontal axis is “length” and vertical axis is sampled depth, and this is used for fence plots.
The input fencespec is either a 2D numpy where each row is X, Y, Z, HLEN, where X, Y are UTM coordinates, Z is depth/time, and HLEN is a length along the fence, or a Polygons instance.
If input fencspec is a numpy 2D, it is important that the HLEN array has a constant increment and ideally a sampling that is less than the map resolution. If a Polygons() instance, this is automated if hincrement is None, and ignored if hincrement is False.
Returns a ndarray with shape (:, 2).
- Parameters
fencespec (
Union[ndarray,object]) – 2D numpy with X, Y, Z, HLEN as rows or a xtgeo Polygons() object.hincrement (
Union[bool,float,None]) – Resampling horizontally. This applies only if the fencespec is a Polygons() instance. If None (default), the distance will be deduced automatically. If False, then it assumes the Polygons can be used as-is.atleast (
Optional[int]) – Minimum number of horizontal samples (only if fencespec is a Polygons instance and hincrement != False)nextend (
Optional[int]) – Extend with nextend * hincrement in both ends (only if fencespec is a Polygons instance and hincrement != False)sampling (
Optional[str]) – Use “bilinear” (default) for interpolation or “nearest” for snapping to nearest node.
- Return type
numpy.ndarray
Example:
fence = xtgeo.Polygons("somefile.pol")
fspec = fence.get_fence(distance=20, nextend=5, asnumpy=True)
surf = xtgeo.RegularSurface("somefile.gri")

arr = surf.get_randomline(fspec)

distance = arr[:, 0]
zval = arr[:, 1]
# matplotlib...
plt.plot(distance, zval)
See also
- Class
Polygons The method
get_fence()which can be used to pregenerate fencespec
- Return type
ndarray- Parameters
fencespec (Union[numpy.ndarray, object]) –
hincrement (Optional[Union[bool, float]]) –
atleast (Optional[int, None]) –
nextend (Optional[int, None]) –
sampling (Optional[str, None]) –
-
get_value_from_xy(point=(0.0, 0.0), sampling='bilinear')[source]¶ Return the map value given a X Y point.
- Parameters
point (float tuple) – Position of X and Y coordinate
sampling (str) – Sampling method, either “bilinear” for bilinear interpolation, or “nearest” for nearest node sampling (e.g. facies maps)
- Returns
The map value (interpolated). None if XY is outside defined map
- Example::
mvalue = map.get_value_from_xy(point=(539291.12, 6788228.2))
Changed in version 2.14: Added keyword option sampling
-
get_values1d(order='C', asmasked=False, fill_value=1e+33, activeonly=False)[source]¶ Get a 1D numpy or masked array of the map values.
- Parameters
order (str) – Flatteting is in C (default) or F order
asmasked (bool) – If true, return as MaskedArray, other as standard numpy ndarray with undef as np.nan or fill_value
fill_value (str) – Relevent only if asmasked is False, this will be the value of undef entries
activeonly (bool) – If True, only active cells. Keys ‘asmasked’ and ‘fill_value’ are not revelant.
- Returns
A numpy 1D array or MaskedArray
-
get_xy_value_from_ij(iloc, jloc, zvalues=None)[source]¶ Returns x, y, z(value) from a single i j location.
- Parameters
iloc (int) – I (col) location (base is 1)
jloc (int) – J (row) location (base is 1)
zvalues (ndarray) – to precompute the numpy surface once in the caller, and submit the numpy array (use surf.get_values1d()).
- Returns
The x, y, z values at location iloc, jloc
-
get_xy_value_lists(lformat='webportal', xyfmt=None, valuefmt=None)[source]¶ Returns two lists for coordinates (x, y) and values.
For lformat = ‘webportal’ (default):
The lists are returned as xylist and valuelist, where xylist is on the format:
[(x1, y1), (x2, y2) …] (a list of x, y tuples)
and valuelist is one the format
[v1, v2, …]
Inactive cells will be ignored.
- Parameters
lformat (string) – List return format (‘webportal’ is default, other options later)
xyfmt (string) – The formatter for xy numbers, e.g. ‘12.2f’ (default None). Note no checks on valid input.
valuefmt (string) – The formatter for values e.g. ‘8.4f’ (default None). Note no checks on valid input.
- Returns
xylist, valuelist
Example
>>> import xtgeo
>>> surf = xtgeo.surface_from_file(surface_dir + '/topreek_rota.gri')
>>> xylist, valuelist = surf.get_xy_value_lists(valuefmt='6.2f')
-
get_xy_values(order='C', asmasked=True)[source]¶ Return coordinates for X and Y as numpy (masked) 2D arrays.
- Parameters
order (str) – ‘C’ (default) or ‘F’ order (row major vs column major)
asmasked (bool) – If True , inactive nodes are masked.
-
get_xy_values1d(order='C', activeonly=True)[source]¶ Return coordinates for X and Y as numpy 1D arrays.
- Parameters
order (str) – ‘C’ (default) or ‘F’ order (row major vs column major)
activeonly (bool) – Only active cells are returned.
-
get_xyz_values1d(order='C', activeonly=True, fill_value=nan)[source]¶ Return coordinates for X Y and Z (values) as numpy 1D arrays.
- Parameters
order (str) – ‘C’ (default) or ‘F’ order (row major vs column major)
activeonly (bool) – Only active cells are returned.
fill_value (float) – If activeonly is False, value of inactive nodes
-
gridding(points, method='linear', coarsen=1)[source]¶ Grid a surface from points.
- Parameters
points (Points) – XTGeo Points instance.
method (str) – Gridding method option: linear / cubic / nearest
coarsen (int) – Coarsen factor, to speed up gridding, but will give poorer result.
Example:
>>> import xtgeo
>>> mypoints = xtgeo.Points(points_dir + '/pointset2.poi')
>>> mysurf = xtgeo.surface_from_file(surface_dir + '/topreek_rota.gri')

>>> # update the surface by gridding the points
>>> mysurf.gridding(mypoints)
- Raises
RuntimeError – If not possible to grid for some reason
ValueError – If invalid input
-
hc_thickness_from_3dprops(xprop=None, yprop=None, hcpfzprop=None, zoneprop=None, zone_minmax=None, dzprop=None, zone_avg=False, coarsen=1, mask_outside=False)[source]¶ Make a thickness weighted HC thickness map.
Make a HC thickness map based on numpy arrays of properties from a 3D grid. The numpy arrays here shall be ndarray, not masked numpies (MaskedArray).
Note that the input hcpfzprop is hydrocarbon fraction multiplied with thickness, which can be achieved by e.g.: cpfz = dz*poro*ntg*shc or by hcpfz = dz*hcpv/vbulk
- Parameters
xprop (ndarray) – 3D numpy array of X coordinates
yprop (ndarray) – 3D numpy array of Y coordinates
hcpfzprop (ndarray) – 3D numpy array of HC fraction multiplied with DZ per cell.
zoneprop (ndarray) – 3D numpy array indicating zonation property, where 1 is the lowest (0 values can be used to exclude parts of the grid)
dzprop (ndarray) – 3D numpy array holding DZ thickness. Will be applied in weighting if zone_avg is active.
zone_minmax (tuple) – (optional) 2 element list indicating start and stop zonation (both start and end spec are included)
zone_avg (bool) – A zone averaging is done prior to map gridding. This may speed up the process a lot, but result will be less precise. Default is False.
coarsen (int) – Select every N’th X Y point in the gridding. Will speed up process, but less precise result. Default=1
mask_outside (bool) – Will mask the result map undef where sum of DZ is zero. Default is False as it costs some extra CPU.
- Returns
True if operation went OK (but check result!), False if not
-
property
ilines¶ The inlines numbering vector (read only).
-
load_values()[source]¶ Import surface values in cases where metadata only is loaded.
Currently, only Irap binary format is supported.
Example:
surfs = []
for i in range(1000):
    surfs.append(xtgeo.surface_from_file(f"myfile{i}.gri", values=False))

# load values in number 88:
surfs[88].load_values()
New in version 2.1.
-
property
metadata¶ Return metadata object instance of type MetaDataRegularSurface.
-
classmethod
methods()[source]¶ Returns the names of the methods in the class.
>>> print(RegularSurface.methods())
METHODS for RegularSurface():
======================
__init__
__repr__
...
-
property
nactive¶ Number of active map nodes (read only).
-
property
name¶ A free form name for the surface, to be used in display etc.
-
property
ncol¶ The NCOL (NX or N-Idir) number, as property (read only).
-
property
npvalues1d¶ (Read only) Map values, as 1D numpy (not masked), undef as np.nan.
In most cases this will be a copy of the values.
Example:
>>> import xtgeo
>>> map = xtgeo.surface_from_file(surface_dir + '/topreek_rota.gri')
>>> values = map.npvalues1d
>>> mean = np.nanmean(values)
>>> values[values <= 0] = np.nan
>>> print(values)
[nan nan ... nan]
-
property
nrow¶ The NROW (NY or N-Jdir) number, as property (read only).
-
operation(opname, value)[source]¶ Do operation on map values.
Do operations on the current map values. Valid operations are:
‘elilt’ or ‘eliminatelessthan’: Eliminate less than <value>
‘elile’ or ‘eliminatelessequal’: Eliminate less or equal than <value>
- Parameters
opname (str) – Name of operation. See list above.
value – A scalar number (float) or a tuple of two floats, dependent on operation opname.
Examples:
surf.operation('elilt', 200) # set all values < 200 as undef
-
operation_polygons(poly, value, opname='add', inside=True)[source]¶ A generic function for map operations inside or outside polygon(s).
- Parameters
poly (Polygons) – A XTGeo Polygons instance
value (float or RegularSurface) – Value to add, subtract etc
opname (str) – Name of operation… ‘add’, ‘sub’, etc
inside (bool) – If True do operation inside polygons; else outside.
-
quickplot(filename=None, title='QuickPlot for Surfaces', subtitle=None, infotext=None, minmax=(None, None), xlabelrotation=None, colormap='rainbow', colortable=None, faults=None, logarithmic=False)[source]¶ Fast surface plot of maps using matplotlib.
- Parameters
filename (str) – Name of plot file; None will plot to screen.
title (str) – Title of plot
subtitle (str) – Subtitle of plot
infotext (str) – Additonal info on plot.
minmax (tuple) – Tuple of min and max values to be plotted. Note that values outside range will be set equal to range limits
xlabelrotation (float) – Rotation in degrees of X labels.
colormap (str) – Name of matplotlib or RMS file or XTGeo colormap. Default is matplotlib’s ‘rainbow’
colortable (str) – Deprecated, for backward compatibility! used colormap instead.
faults (dict) – If fault plot is wanted, a dictionary on the form => {‘faults’: XTGeo Polygons object, ‘color’: ‘k’}
logarithmic (bool) – If True, a logarithmic contouring color scale will be used.
-
refine(factor)[source]¶ Refine a surface with a factor.
Range for factor is 2 to 10.
Note that there may be some ‘loss’ of nodes at the edges of the updated map, as only the ‘inside’ nodes in the updated map versus the input map are applied.
- Parameters
factor (int) – Refinement factor
-
resample(other, mask=True, sampling='bilinear')[source]¶ Resample an instance surface values from another surface instance.
Note that there may be some ‘loss’ of nodes at the edges of the updated map, as only the ‘inside’ nodes in the updated map versus the input map are applied.
The interpolation algorithm in resample is bilinear interpolation. The topolopogy of the surface (map definitions, rotation, …) will not change, only the map values. Areas with undefined nodes in
otherwill become undefined in the instance if mask is True; othewise they will be kept as is.- Parameters
other (RegularSurface) – Surface to resample from.
mask (bool) – If True (default) nodes outside will be made undefined, if False then values will be kept as original
sampling (str) – Either ‘bilinear’ interpolation (default) or, ‘nearest’ for nearest node. The latter can be useful for resampling discrete maps.
Example:
# map with 230x210 columns, rotation 20
surf1 = xtgeo.surface_from_file("some1.gri")
# map with 270x190 columns, rotation 0
surf2 = xtgeo.surface_from_file("some2.gri")
# will sample (interpolate) surf2's values to surf1
surf1.resample(surf2)
- Returns
Instance’s surface values will be updated in-place.
Changed in version 2.9: Added
maskkeyword, default is True for backward compatibility.Changed in version 2.21: Added
samplingkeyword option.
-
property
rotation¶ The rotation, anticlock from X axis, in degrees [0..360>.
-
set_values1d(val, order='C')[source]¶ Update the values attribute based on a 1D input, multiple options.
If values are np.nan or values are > UNDEF_LIMIT, they will be masked.
- Parameters
val (list-like) – Set values as a 1D array
order (str) – Input is C (default) or F order
-
similarity_index(other)[source]¶ Report the degree of similarity between two maps, by comparing mean.
The method computes the average per surface, and the similarity is difference in mean divided on mean of self. I.e. values close to 0.0 mean small difference.
- Parameters
other (surface object) – The other surface to compare with
-
slice_cube(cube, zsurf=None, sampling='nearest', mask=True, snapxy=False, deadtraces=True, algorithm=2)[source]¶ Slice the cube and update the instance surface to sampled cube values.
- Parameters
cube (object) – Instance of a Cube()
zsurf (surface object) – Instance of a depth (or time) map, which is the depth or time map (or…) that is used a slicer. If None, then the surface instance itself is used a slice criteria. Note that zsurf must have same map defs as the surface instance.
sampling (str) – ‘nearest’ for nearest node (default), or ‘trilinear’ for trilinear interpolation.
mask (bool) – If True (default), then the map values outside the cube will be undef. Otherwise, map will be kept as is.
snapxy (bool) – If True (optional), then the map values will get values at nearest Cube XY location. Only relevant to use if surface is derived from seismic coordinates (e.g. Auto4D).
deadtraces (bool) – If True (default) then dead cube traces (given as value 2 in SEGY trace headers), are treated as undefined, and map will become undefined at dead trace location.
algorithm (int) – 1 for legacy method, 2 (default from 2.9) for new method available in xtgeo from version 2.9
Example:
>>> import xtgeo
>>> cube = xtgeo.cube_from_file(cube_dir + "/ib_test_cube2.segy")
>>> surf = xtgeo.surface_from_file(surface_dir + '/topreek_rota.gri')
>>> # update surf to sample cube values:
>>> surf.slice_cube(cube)
- Raises
Exception if maps have different definitions (topology) –
RuntimeWarning if number of sampled nodes is less than 10% –
Changed in version 2.9: Added
algorithmkeyword, default is 2
-
slice_cube_window(cube, zsurf=None, other=None, other_position='below', sampling='nearest', mask=True, zrange=None, ndiv=None, attribute='max', maskthreshold=0.1, snapxy=False, showprogress=False, deadtraces=True, algorithm=2)[source]¶ Slice the cube within a vertical window and get the statistical attrubutes.
The statistical attributes can be min, max etc. Attributes are:
‘max’ for maximum
‘min’ for minimum
‘rms’ for root mean square
‘mean’ for expected value
‘var’ for variance (population var; https://en.wikipedia.org/wiki/Variance)
‘maxpos’ for maximum of positive values
‘maxneg’ for negative maximum of negative values
‘maxabs’ for maximum of absolute values
‘sumpos’ for sum of positive values using cube sampling resolution
‘sumneg’ for sum of negative values using cube sampling resolution
‘meanabs’ for mean of absolute values
‘meanpos’ for mean of positive values
‘meanneg’ for mean of negative values
Note that ‘all’ can be used to select all attributes that are currently available.
- Parameters
cube (Cube) – Instance of a Cube()
zsurf (RegularSurface) – Instance of a depth (or time) map, which is the depth or time map (or…) that is used a slicer. If None, then the surface instance itself is used a slice criteria. Note that zsurf must have same map defs as the surface instance.
other (RegularSurface) – Instance of other surface if window is between surfaces instead of a static window. The zrange input is then not applied.
sampling (str) – ‘nearest’/’trilinear’/’cube’ for nearest node (default), or ‘trilinear’ for trilinear interpolation. The ‘cube’ option is only available with algorithm = 2 and will overrule ndiv and sample at the cube’s Z increment resolution.
mask (bool) – If True (default), then the map values outside the cube will be undef, otherwise map will be kept as-is
zrange (float) – The one-sided “radius” range of the window, e.g. 10 (10 is default) units (e.g. meters if in depth mode). The full window is +- zrange (i.e. diameter). If other surface is present, zrange is computed based on that.
ndiv (int) – Number of intervals for sampling within zrange. None means ‘auto’ sampling, using 0.5 of cube Z increment as basis. If algorithm = 2 and sampling is ‘cube’, the cube Z increment will be used.
attribute (str or list) – The requested attribute(s), e.g. ‘max’ value. May also be a list of attributes, e.g. [‘min’, ‘rms’, ‘max’]. By such, a dict of surface objects is returned. Note ‘all’ will make a list of possible attributes
maskthreshold (float) – Only if two surface; if isochore is less than given value, the result will be masked.
snapxy (bool) – If True (optional), then the map values will get values at nearest Cube XY location. Only relevant to use if surface is derived from seismic coordinates (e.g. Auto4D).
showprogress (bool) – If True, then a progress is printed to stdout.
deadtraces (bool) – If True (default) then dead cube traces (given as value 2 in SEGY trace headers), are treated as undefined, nad map will be undefined at dead trace location.
algorithm (int) – 1 for legacy method, 2 (default) for new faster and more precise method available from xtgeo version 2.9.
Example:
>>> import xtgeo
>>> cube = xtgeo.Cube(cube_dir + "/ib_test_cube2.segy")
>>> surf = xtgeo.surface_from_file(surface_dir + '/topreek_rota.gri')
>>> # update surf to sample cube values in a total range of 30 m:
>>> surf.slice_cube_window(cube, attribute='min', zrange=15.0)

>>> # Here a list is given instead:
>>> alst = ['min', 'max', 'rms']

>>> myattrs = surf.slice_cube_window(cube, attribute=alst, zrange=15.0)
>>> for attr in myattrs.keys():
...     _ = myattrs[attr].to_file(
...         outdir + '/myfile_' + attr + '.gri'
...     )
- Raises
Exception if maps have different definitions (topology) –
ValueError if attribute is invalid. –
- Returns
If attribute is a string, then the instance is updated and None is returned. If attribute is a list, then a dictionary of surface objects is returned.
Changed in version 2.9: Added
algorithmkeyword, default is now 2, while 1 is the legacy version
-
slice_grid3d(grid, prop, zsurf=None, sbuffer=1)[source]¶ Slice the grid property and update the instance surface to sampled values.
- Parameters
grid (Grid) – Instance of a Grid.
prop (GridProperty) – Instance of a GridProperty, belongs to grid
zsurf (surface object) – Instance of map, which is used a slicer. If None, then the surface instance itself is used a slice criteria. Note that zsurf must have same map defs as the surface instance.
sbuffer (int) – Default is 1; if “holes” after sampling extend this to e.g. 3
Example:
>>> import xtgeo
>>> grd = xtgeo.grid_from_file(reek_dir + '/REEK.EGRID')
>>> prop = xtgeo.gridproperty_from_file(
...     reek_dir + '/REEK.UNRST',
...     name='PRESSURE',
...     date="first",
...     grid=grd,
... )
>>> surf = xtgeo.surface_from_file(surface_dir + '/topreek_rota.gri')
>>> # update surf to sample the 3D grid property:
>>> surf.slice_grid3d(grd, prop)
- Raises
Exception if maps have different definitions (topology) –
-
smooth(method='median', iterations=1, width=1)[source]¶ Various smoothing methods for surfaces.
- Parameters
method – Smoothing method (median)
iterations – Number of iterations
width – Range of influence (in nodes)
New in version 2.1.
-
to_file(mfile, fformat='irap_binary', pmd_dataunits=(15, 10), engine='cxtgeo')[source]¶ Export a surface (map) to file.
Note, for zmap_ascii and storm_binary an unrotation will be done automatically. The sampling will be somewhat finer than the original map in order to prevent aliasing. See
unrotate().- Parameters
mfile (
Union[str,Path,BytesIO]) – Name of file, Path instance or IOBytestream instance. An alias can be e.g. “%md5sum%” or “%fmu-v1%” with string or Path() input.fformat (
Optional[str]) – File format, irap_binary/irap_ascii/zmap_ascii/ storm_binary/ijxyz/petromod/xtg*. Default is irap_binary.pmd_dataunits (
Optional[Tuple[int,int]]) – A tuple of length 2 for petromod format, spesifying metadata for units (DataUnitDistance, DataUnitZ).engine (
Optional[str]) – Default is “cxtgeo” which use a C backend. Optionally a pure python “python” reader will be used, which in general is slower but may be safer when reading memory streams and/or threading. Engine is relevant for Irap binary, Irap ascii and zmap. This is mainly a developer setting.
- Returns
The actual file instance, or None if io.Bytestream
- Return type
ofile (pathlib.Path)
Examples:
>>> # read and write to ordinary file
>>> surf = xtgeo.surface_from_file(
...     surface_dir + '/topreek_rota.fgr',
...     fformat = 'irap_ascii'
... )
>>> surf.values = surf.values + 300
>>> filename = surf.to_file(
...     outdir + '/topreek_rota300.fgr',
...     fformat = 'irap_ascii'
... )

>>> # writing to io.BytesIO:
>>> stream = io.BytesIO()
>>> surf.to_file(stream, fformat="irap_binary")

>>> # read from memory stream:
>>> _ = stream.seek(0)
>>> newsurf = xtgeo.surface_from_file(stream, fformat = 'irap_binary')
Changed in version 2.5: Added support for BytesIO
Changed in version 2.13: Improved support for BytesIO
Changed in version 2.14: Support for alias file name and return value
-
to_hdf(mfile, compression='lzf')[source]¶ Export a surface (map) with metadata to a HDF5 file.
Warning
This implementation is currently experimental and only recommended for testing.
The file extension shall be ‘.hdf’
- Parameters
mfile (
Union[str,Path,BytesIO]) – Name of file, Path instance or BytesIO instance. An alias can be e.g.$md5sum.hdf,$fmu-v1.hdfwith string or Path() input.compression (
Optional[str]) – Compression method, None, lzf (default), blosc
- Returns
The actual file instance, or None if io.Bytestream
- Return type
pathlib.Path
Example
>>> import xtgeo
>>> surf = xtgeo.surface_from_file(surface_dir + '/topreek_rota.gri')
>>> filepath = surf.to_hdf(outdir + "/topreek_rota.hdf")
New in version 2.14.
-
to_roxar(project, name, category, stype='horizons', realisation=0)[source]¶ Store (export) a regular surface to a Roxar RMS project.
The export to the RMS project can be done either within the project or outside the project. The storing is done to the Horizons or the Zones folder in RMS.
Note
The horizon or zone name and category must exists in advance, otherwise an Exception will be raised.
When project is file path (direct access, outside RMS) then
to_roxar()will implicitly do a project save. Otherwise, the project will not be saved until the user do an explicit project save action.- Parameters
project (str or special) – Name of project (as folder) if outside RMS, og just use the magic project word if within RMS.
name (str) – Name of surface/map
category (str) – Required for horizons/zones: e.g. ‘DS_extracted’. For clipboard/general2d_data is reperesent the folder(s), where “” or None means no folder, while e.g. “myfolder/subfolder” means that folders myfolder/subfolder will be created if not already present. For stype = ‘trends’, the category will not be applied
stype (str) – RMS folder type, ‘horizons’ (default), ‘zones’, ‘clipboard’ ‘general2d_data’, ‘trends’
realisation (int) – Realisation number, default is 0
- Raises
ValueError – If name or category does not exist in the project
Example
Here the from_roxar method is used to initiate the object directly:
import xtgeo
topupperreek = xtgeo.surface_from_roxar(project, 'TopUpperReek',
                                      'DS_extracted')
topupperreek.values += 200

# export to file:
topupperreek.to_file('topupperreek.gri')

# store in project
topupperreek.to_roxar(project, 'TopUpperReek', 'DS_something')
Note:
When dealing with surfaces to and from ``stype="trends"``, the surface must
exist in advance, i.e. the Roxar API do not allow creating new surfaces.
Actually trends are read only, but a workaround using ``load()`` in Roxar
API makes it possible to overwrite existing surface trends. In addition,
``realisation`` is not applied in trends.
New in version 2.1: clipboard support
New in version 2.19: general2d_data and trends support
-
translate_coordinates(translate=(0, 0, 0))[source]¶ Translate a map in X Y VALUE space.
- Parameters
translate (tuple) – Translate (shift) distance in X Y Z
Example:
>>> import xtgeo
>>> mysurf = xtgeo.surface_from_file(surface_dir + '/topreek_rota.gri')
>>> print(mysurf.xori, mysurf.yori)
468895.125 5932889.5
>>> mysurf.translate_coordinates((300,500,0))
>>> print(mysurf.xori, mysurf.yori)
469195.125 5933389.5
-
property
undef¶ Returns the undef map value (read only).
-
property
undef_limit¶ Returns the undef_limit map value (read only).
-
unrotate(factor=2)[source]¶ Unrotete a map instance, and this will also change nrow, ncol, xinc, etc.
The default sampling (factor=2) makes a finer grid in order to avoid artifacts, and this default can be used in most cases.
If an even finer grid is wanted, increase the factor. Theoretically the new increment for factor=N is between \(\\frac{1}{N}\) and \(\\frac{1}{N}\\sqrt{2}\) of the original increment, dependent on the rotation of the original surface.
If the current instance already is unrotated, nothing is done.
- Parameters
factor (int) – Refinement factor (>= 1)
-
property
values¶ The map values, as 2D masked numpy (float64), shape (ncol, nrow).
When setting values as a scalar, the current mask will be preserved.
When setting values, list-like input (lists, tuples) is also accepted, as long as the length is correct and the entries are number-like.
In order to specify undefined values, you can specify the
undefattribute in the list, or usefloat("nan").Example:
# list like input where nrow=3 and ncol=5 (15 entries)
newvalues = list(range(15))
newvalues[2] = srf.undef
srf.values = newvalues  # here, entry 2 will be undefined
-
property
values1d¶ (Read only) Map values, as 1D numpy masked, normally a numpy view(?).
Example:
map = xtgeo.surface_from_file('myfile.gri')
map.values1d
-
property
xinc¶ The X increment (or I dir increment).
-
property
xlines¶ The xlines numbering vector (read only).
-
property
xmax¶ The maximum X coordinate (read only).
-
property
xmin¶ The minimim X coordinate (read only).
-
property
xori¶ The X coordinate origin of the map.
-
property
yflip¶ The Y flip (handedness) indicator 1, or -1 (read only).
The value 1 (default) means a left-handed system if depth values are positive downwards. Assume -1 is rare, but may happen when surface is derived from seismic cube.
-
property
yinc¶ The Y increment (or I dir increment).
-
property
ymax¶ The maximum Y xoordinate (read only).
-
property
ymin¶ The minimim Y coordinate (read only).
-
property
yori¶ The Y coordinate origin of the map.
Surfaces
Classes
-
class
xtgeo.Surfaces(surfaces=None, subtype=None, order=None)[source]¶ Bases:
objectClass for a collection of Surface objects, for operations that involves a number of surfaces, such as statistical numbers.
A collection of surfaces can be different things:
A list if surfaces in stratigraphic order
A collection of different realisations of the same surface
A collection of isochores
- Parameters
input (list, optional) – A list of XTGeo objects and/or file names)
subtype (str) – “tops”, “isochores”, or None (default)
order (str) – Assummed order: “same”, “stratigraphic”, None(default)
surfaces (Optional[List[xtgeo.surface.regular_surface.RegularSurface], None]) –
See also
Class
RegularSurfaceclass.New in version 2.1.
Public Data Attributes:
surfacesGet or set a list of individual surfaces
Public Methods:
append(slist)Append surfaces from either a list of RegularSurface objects, a list of files, or a mix.
describe([flush])Describe an instance by printing to stdout
copy()Copy a Surfaces instance to a new unique instance (a deep copy).
get_surface(name)Get a RegularSurface() instance by name, or return None if name not found
from_grid3d(grid[, subgrids, rfactor])Derive surfaces from a 3D grid
apply(func, *args, **kwargs)Apply a function to the Surfaces array.
statistics([percentiles])Return statistical measures from the surfaces.
-
__init__(surfaces=None, subtype=None, order=None)[source]¶ Initialize self. See help(type(self)) for accurate signature.
- Parameters
surfaces (Optional[List[xtgeo.surface.regular_surface.RegularSurface], None]) –
subtype (Optional[Literal[tops, isochores], None]) –
order (Optional[Literal[same, stratigraphic], None]) –
-
append(slist)[source]¶ Append surfaces from either a list of RegularSurface objects, a list of files, or a mix.
-
apply(func, *args, **kwargs)[source]¶ Apply a function to the Surfaces array.
The return value of the function (numpy nan comptatible) will be a numpy array of the same shape as the first surface.
E.g. surfs.apply(np.nanmean, axis=0) will return the mean surface.
- Parameters
func – Function to apply, e.g. np.nanmean
args – The function arguments
kwargs – The function keyword arguments
- Raises
ValueError – If surfaces differ in topology.
-
from_grid3d(grid, subgrids=True, rfactor=1)[source]¶ Derive surfaces from a 3D grid
Deprecated since version 2.15: This will be removed in 4.0. Use xtgeo.surface.surfaces_from_grid() instead
-
get_surface(name)[source]¶ Get a RegularSurface() instance by name, or return None if name not found
-
statistics(percentiles=None)[source]¶ Return statistical measures from the surfaces.
The statistics returned is: * mean: the arithmetic mean surface * std: the standard deviation surface (where ddof = 1) * percentiles: on demand (such operations may be slow)
Currently this function expects that the surfaces all have the same shape/topology.
- Parameters
percentiles (list of float) – If defined, a list of perecentiles to evaluate e.g. [10, 50, 90] for p10, p50, p90
- Returns
A dictionary of statistical measures, see list above
- Return type
dict
- Raises
ValueError – If surfaces differ in topology.
Example:
surfs = Surfaces(mylist)  # mylist is a collection of files
stats = surfs.statistics()
# export the mean surface
stats["mean"].to_file("mymean.gri")
Changed in version 2.13: Added percentile
-
property
surfaces¶ Get or set a list of individual surfaces
Points and Polygons
Points
Functions
-
xtgeo.points_from_file(pfile, fformat='guess')[source]¶ Make an instance of a Points object directly from file import.
Supported formats are:
‘xyz’ or ‘poi’ or ‘pol’: Simple XYZ format
‘zmap’: ZMAP line format as exported from RMS (e.g. fault lines)
‘rms_attr’: RMS points formats with attributes (extra columns)
‘guess’: Try to choose file format based on extension
- Parameters
pfile (
Union[str,Path]) – Name of file or pathlib object.fformat (
Optional[str]) – File format, xyz/pol/… Default is guess where file extension or file signature is parsed to guess the correct format.
Example:
import xtgeo
mypoints = xtgeo.points_from_file('somefile.xyz')
-
xtgeo.points_from_roxar(project, name, category, stype='horizons', realisation=0, attributes=False)[source]¶ Load a Points instance from Roxar RMS project.
The import from the RMS project can be done either within the project or outside the project.
Note also that horizon/zone/faults name and category must exists in advance, otherwise an Exception will be raised.
- Parameters
project – Name of project (as folder) if outside RMS, or just use the magic project word if within RMS.
name (
str) – Name of points itemcategory (
str) – For horizons/zones/faults: for example ‘DL_depth’ or use a folder notation on clipboard/general2d_data.stype (
str) – RMS folder type, ‘horizons’ (default), ‘zones’, ‘clipboard’, ‘general2d_data’realisation (
int) – Realisation number, default is 0attributes (
bool) – If True, attributes will be preserved (from RMS 11)
Example:
# inside RMS:
import xtgeo
mypoints = xtgeo.points_from_roxar(project, 'TopEtive', 'DP_seismic')
New in version 2.19: general2d_data support is added
-
xtgeo.points_from_surface(regular_surface, zname='Z_TVDSS')[source]¶ This makes an instance of a Points directly from a RegularSurface object.
Each surface node will be stored as a X Y Z point.
- Parameters
regular_surface – XTGeo RegularSurface() instance
zname (
str) – Name of third column
New in version 2.16: Replaces the from_surface() method.
-
xtgeo.points_from_wells(wells, tops=True, incl_limit=None, top_prefix='Top', zonelist=None, use_undef=False)[source]¶ Get tops or zone points data from a list of wells.
- Parameters
wells (
List[Well]) – List of XTGeo well objects. If a list of well files, the routine will try to load well based on file signature and/or extension, but only default settings are applied. Hence this is less flexible and more fragile.tops (
bool) – Get the tops if True (default), otherwise zone.incl_limit (
Optional[float]) – Inclination limit for zones (thickness points)top_prefix (
str) – Prefix used for Tops.zonelist (
Optional[list]) – Which zone numbers to apply, None means all.use_undef (
bool) – If True, then transition from UNDEF is also used.
- Returns
None if empty data, otherwise a Points() instance.
Example:
wells = [xtgeo.Well("w1.w"), xtgeo.Well("w2.w")]
points = xtgeo.points_from_wells(wells)
Note
The deprecated method
from_wells()returns the number of wells that contribute with points. This is now implemented through the function get_nwells(). Hence the following code:nwells_applied = poi.from_wells(...) # deprecated method # vs poi = xtgeo.points_from_wells(...) nwells_applied = poi.get_nwells()
New in version 2.16: Replaces
from_wells()
-
xtgeo.points_from_wells_dfrac(wells, dlogname, dcodes, incl_limit=90, count_limit=3, zonelist=None, zonelogname=None)[source]¶ Get fraction of discrete code(s) e.g. facies per zone.
- Parameters
wells (
List[Well]) – List of XTGeo well objects. If a list of file names, the routine will try to load well based on file signature and/or extension, but only default settings are applied. Hence this is less flexible and more fragile.dlogname (
str) – Name of discrete log (e.g. Facies)dcodes (
List[int]) – Code(s) to get fraction for, e.g. [3]incl_limit (
float) – Inclination limit for zones (thickness points)count_limit (
int) – Min. no of counts per segment for valid resultzonelist (
Optional[list]) – Which zone numbers to apply, default None means all.zonelogname (
Optional[str]) – If None, the zonelogname property in the well object will be applied. This option is particualr useful if one uses wells directly from files.
- Returns
None if empty data, otherwise a Points() instance.
Example:
wells = [xtgeo.Well("w1.w"), xtgeo.Well("w2.w")]
points = xtgeo.points_from_wells_dfrac(
        wells, dlogname="Facies", dcodes=[4], zonelogname="ZONELOG"
    )
Note
The deprecated method
dfrac_from_wells()returns the number of wells that contribute with points. This is now implemented through the method get_nwells(). Hence the following code:nwells_applied = poi.dfrac_from_wells(...) # deprecated method # vs poi = xtgeo.points_from_wells_dfrac(...) nwells_applied = poi.get_nwells()
New in version 2.16: Replaces
dfrac_from_wells()
Classes
-
class
xtgeo.Points(values=None, xname='X_UTME', yname='Y_UTMN', zname='Z_TVDSS', attributes=None, filesrc=None)[source]¶ Bases:
xtgeo.xyz._xyz.XYZClass for a Points data in XTGeo.
The Points class is a subclass of the
XYZabstract class, and the point set itself is a pandas dataframe object.For points, 3 float columns (X Y Z) are mandatory. In addition it is possible to have addiotional points attribute columns, and such attributes may be integer, strings or floats.
The instance can be made either from file (then as classmethod), from another object or by a spesification, e.g. from file or a surface:
xp1 = xtgeo.points_from_file('somefilename', fformat='xyz')
# or
regsurf = xtgeo.surface_from_file("somefile.gri")
xp2 = xtgeo.points_from_surface(regsurf)
You can also initialise points from list of tuples/lists in Python, where each tuple is a (X, Y, Z) coordinate:
plist = [(234, 556, 12), (235, 559, 14), (255, 577, 12)]
mypoints = Points(values=plist)
The tuples can also contain point attributes which needs spesification via an attributes dictionary:
plist = [
    (234, 556, 12, "Well1", 22),
    (235, 559, 14, "Well2", 44),
    (255, 577, 12, "Well3", 55)]
attrs = {"WellName": "str", "ID", "int"}
mypoints = Points(values=plist, attributes=attrs)
And points can be initialised from a 2D numpy array or an existing dataframe:
>>> mypoints1 = Points(values=[(1,1,1), (2,2,2), (3,3,3)])
>>> mypoints2 = Points(
...     values=pd.DataFrame(
...          [[1, 2, 3], [1, 2, 3], [1, 2, 3]],
...          columns=["X_UTME", "Y_UTMN", "Z_TVDSS"]
...     )
... )
Similar as for lists, attributes are alse possible for numpy and dataframes.
Default column names in the dataframe:
X_UTME: UTM X coordinate as self._xname
Y_UTMN: UTM Y coordinate as self._yname
Z_TVDSS: Z coordinate, often depth below TVD SS, but may also be something else! Use zname attribute to change name.
Note
Attributes may have undefined entries. Pandas version 0.21 (which is applied for RMS version up to 12.0.x) do not support NaN values for Integers. The solution is store undefined values as large numbers, xtgeo.UNDEF_INT (2000000000) for integers and xtgeo.UNDEF (10e32) for float values. This will change from xtgeo version 3.x where Pandas version 1 and above will be required, which in turn support will pandas.NA entries.
- Parameters
values (
Union[list,ndarray,DataFrame]) – Provide input values on various forms (list-like or dataframe).xname (
str) – Name of first (X) mandatory column, default is X_UTME.yname (
str) – Name of second (Y) mandatory column, default is Y_UTMN.zname (
str) – Name of third (Z) mandatory column, default is Z_TVDSS.attributes (
Optional[dict]) – A dictionary for attribute columns as ‘name: type’, e.g. {“WellName”: “str”, “IX”: “int”}. This is applied when values are input and is to name and type the extra attribute columns in a point set.filesrc (str) –
Initialisation of Points().
Public Data Attributes:
dataframeReturns or set the Pandas dataframe object.
Inherited from
XYZxnameReturns or set the name of the X column.
ynameReturns or set the name of the Y column.
znameReturns or set the name of the Z column.
dataframeReturn or set the Pandas dataframe object.
nrowReturns the Pandas dataframe object number of rows.
Public Methods:
from_file(pfile[, fformat])Deprecated since version 2.16.
from_roxar(project, name, category[, stype, …])Load a points/polygons item from a Roxar RMS project (deprecated).
from_dataframe(dfr[, east, north, tvdmsl, …])Import points/polygons from existing Pandas dataframe.
to_file(pfile[, fformat, attributes, …])Export Points to file.
from_wells(wells[, tops, incl_limit, …])Get tops or zone points data from a list of wells.
from_list(plist)Deprecated since version 2.16.
dfrac_from_wells(wells, dlogname, dcodes[, …])Get fraction of discrete code(s) (e.g.
to_roxar(project, name, category[, stype, …])Export (store) a Points item to a Roxar RMS project.
copy()Returns a deep copy of an instance.
from_surface(surf[, zname])Get points as X Y Value from a surface object nodes (deprecated).
snap_surface(surf[, activeonly])Snap (transfer) the points Z values to a RegularSurface
get_boundary()Get the square XYZ window (boundaries) of the instance.
Inherited from
XYZcopy()Returns a deep copy of an instance
describe([flush])Describe an instance by printing to stdout
from_file(pfile[, fformat])Import Points or Polygons from a file (deprecated).
from_list(plist)Create Points or Polygons from a list-like input (deprecated).
protected_columns()- returns
Columns not deleted by
delete_columns(), for
geometry_columns()- returns
Columns can be deleted silently by
delete_columns()
delete_columns(clist[, strict])Delete one or more columns by name.
get_boundary()Get the square XYZ window (boundaries) of the instance.
operation_polygons(poly, value[, opname, inside])A generic function for operations restricted to inside or outside polygon(s).
add_inside(poly, value)Add a value (scalar) to points inside polygons.
add_outside(poly, value)Add a value (scalar) to points outside polygons.
sub_inside(poly, value)Subtract a value (scalar) to points inside polygons.
sub_outside(poly, value)Subtract a value (scalar) to points outside polygons.
mul_inside(poly, value)Multiply a value (scalar) to points inside polygons.
mul_outside(poly, value)Multiply a value (scalar) to points outside polygons.
div_inside(poly, value)Divide a value (scalar) to points inside polygons.
div_outside(poly, value)Divide a value (scalar) outside polygons (value 0.0 will give result 0).
set_inside(poly, value)Set a value (scalar) to points inside polygons.
set_outside(poly, value)Set a value (scalar) to points outside polygons.
eli_inside(poly)Eliminate current points inside polygons.
eli_outside(poly)Eliminate current points outside polygons.
-
__init__(values=None, xname='X_UTME', yname='Y_UTMN', zname='Z_TVDSS', attributes=None, filesrc=None)[source]¶ Initialisation of Points().
- Parameters
values (Union[list, numpy.ndarray, pandas.core.frame.DataFrame]) –
xname (str) –
yname (str) –
zname (str) –
attributes (Optional[dict, None]) –
filesrc (str) –
-
add_inside(poly, value)¶ Add a value (scalar) to points inside polygons.
See notes under
operation_polygons().
-
add_outside(poly, value)¶ Add a value (scalar) to points outside polygons.
See notes under
operation_polygons().
-
property
dataframe¶ Returns or set the Pandas dataframe object.
- Return type
DataFrame
-
delete_columns(clist, strict=False)¶ Delete one or more columns by name.
Note that the columns returned by
protected_columns(self)()(for instance, the coordinate columns) will not be deleted.- Parameters
self (obj) – Points or Polygons
clist (list) – Name of columns
strict (bool) – I False, will not trigger exception if a column is not found. Otherways a ValueError will be raised.
- Raises
ValueError – If strict is True and columnname not present
- Example::
mypoly.delete_columns([“WELL_ID”, mypoly.hname, mypoly.dhname])
New in version 2.1.
-
describe(flush=True)¶ Describe an instance by printing to stdout
-
dfrac_from_wells(wells, dlogname, dcodes, incl_limit=90, count_limit=3, zonelist=None, zonelogname=None)[source]¶ Get fraction of discrete code(s) (e.g. facies) per zone.
- Parameters
wells (list) – List of XTGeo well objects
dlogname (str) – Name of discrete log (e.g. Facies)
dcodes (list of int) – Code(s) to get fraction for, e.g. [3]
incl_limit (float) – Inclination limit for zones (thickness points)
count_limit (int) – Min. no of counts per segment for valid result
zonelist (list of int) – Whihc zones to compute for (default None means that all zones will be evaluated)
zonelogname (str) – Name of zonelog; if None than the well.zonelogname property will be applied.
- Returns
None if well list is empty; otherwise the number of wells.
- Raises
Todo –
Deprecated since version 2.16: Use classmethod
points_from_wells_dfrac()instead.Deprecated since version 2.16: This will be removed in 4.0. Use xtgeo.points_from_wells_dfrac() instead.
-
div_inside(poly, value)¶ Divide a value (scalar) to points inside polygons.
See notes under
operation_polygons().
-
div_outside(poly, value)¶ Divide a value (scalar) outside polygons (value 0.0 will give result 0).
See notes under
operation_polygons().
-
eli_inside(poly)¶ Eliminate current points inside polygons.
See notes under
operation_polygons().
-
eli_outside(poly)¶ Eliminate current points outside polygons.
See notes under
operation_polygons().
-
from_dataframe(dfr, east='X', north='Y', tvdmsl='Z', attributes=None)[source]¶ Import points/polygons from existing Pandas dataframe.
- Parameters
dfr (dataframe) – Pandas dataframe.
east (str) – Name of easting column in input dataframe.
north (str) – Name of northing column in input dataframe.
tvdmsl (str) – Name of depth column in input dataframe.
attributes (dict) – Additional metadata columns, on form {“IX”: “I”, …}; “IX” here is the name of the target column, and “I” is the name in the input dataframe.
New in version 2.13.
Deprecated since version 2.16: Use points constructor directly instead
Deprecated since version 2.16: This will be removed in 4.0. Use xtgeo.Points(values=dfr[[east, nort, tvdsml]], xname=east, yname=north, zname=tvdmsl) instead
-
from_file(pfile, fformat='xyz')[source]¶ Deprecated since version 2.16: This will be removed in 4.0. Use xtgeo.points_from_file() instead
-
from_list(plist)[source]¶ Deprecated since version 2.16: This will be removed in 4.0. Use direct Points() initialisation instead
-
from_roxar(project, name, category, stype='horizons', realisation=0, attributes=False)[source]¶ Load a points/polygons item from a Roxar RMS project (deprecated).
The import from the RMS project can be done either within the project or outside the project.
Note that the preferred shortform for (use polygons as example):
import xtgeo
mypoly = xtgeo.xyz.Polygons()
mypoly.from_roxar(project, 'TopAare', 'DepthPolys')
is now:
import xtgeo
mysurf = xtgeo.polygons_from_roxar(project, 'TopAare', 'DepthPolys')
Note also that horizon/zone/faults name and category must exists in advance, otherwise an Exception will be raised.
- Parameters
project (str or special) – Name of project (as folder) if outside RMS, og just use the magic project word if within RMS.
name (str) – Name of polygons item
category (str) – For horizons/zones/faults: for example ‘DL_depth’ or use a folder notation on clipboard/general2d_data.
stype (str) – RMS folder type, ‘horizons’ (default) or ‘zones’ etc!
realisation (int) – Realisation number, default is 0
attributes (bool) – If True, attributes will be preserved (from RMS 11)
- Returns
Object instance updated
- Raises
ValueError – Various types of invalid inputs.
Deprecated since version 2.16: Use xtgeo.points_from_roxar() or xtgeo.polygons_from_roxar()
Deprecated since version 2.16: This will be removed in 4.0. Use xtgeo.points_from_roxar() instead.
-
from_surface(surf, zname='Z_TVDSS')[source]¶ Get points as X Y Value from a surface object nodes (deprecated).
Note that undefined surface nodes will not be included.
- Parameters
surf (RegularSurface) – A XTGeo RegularSurface object instance.
zname (str) – Name of value column (3’rd column)
Example:
topx = RegularSurface('topx.gri')
topx_aspoints = Points()
topx_aspoints.from_surface(topx)

# alternative shortform:
topx_aspoints = Points(topx)  # get an instance directly

topx_aspoints.to_file('mypoints.poi')  # export as XYZ file
Deprecated since version 2.16: Use xtgeo.points_from_surface() instead.
Deprecated since version 2.16: This will be removed in 4.0. Use xtgeo.points_from_surface() instead
-
from_wells(wells, tops=True, incl_limit=None, top_prefix='Top', zonelist=None, use_undef=False)[source]¶ Get tops or zone points data from a list of wells.
- Parameters
wells (list) – List of XTGeo well objects
tops (bool) – Get the tops if True (default), otherwise zone
incl_limit (float) – Inclination limit for zones (thickness points)
top_prefix (str) – Prefix used for Tops
zonelist (list-like) – Which zone numbers to apply.
use_undef (bool) – If True, then transition from UNDEF within zonelog is also used.
- Returns
None if well list is empty; otherwise the number of wells.
- Raises
Todo –
Deprecated since version 2.16: Use classmethod
points_from_wells()insteadDeprecated since version 2.16: This will be removed in 4.0. Use xtgeo.points_from_wells() instead.
-
geometry_columns()¶ - Returns
Columns can be deleted silently by
delete_columns()
-
get_boundary()[source]¶ Get the square XYZ window (boundaries) of the instance.
- Returns
(xmin, xmax, ymin, ymax, zmin, zmax)
See also
The class method
Polygons.boundary_from_points()
-
mul_inside(poly, value)¶ Multiply a value (scalar) to points inside polygons.
See notes under
operation_polygons().
-
mul_outside(poly, value)¶ Multiply a value (scalar) to points outside polygons.
See notes under
operation_polygons().
-
property
nrow¶ Returns the Pandas dataframe object number of rows.
-
operation_polygons(poly, value, opname='add', inside=True)¶ A generic function for operations restricted to inside or outside polygon(s).
The operations are performed on the Z values, while the ‘inside’ or ‘outside’ of polygons are purely based on X and Y values (typically X is East and Y in North coordinates).
The operations are XYZ generic i.e. done on the points that defines the Polygon or the point in Points, depending on the calling instance.
Possible
opnamestrings:add: add the valuesub: substract the valuemul: multiply the valuediv: divide the valueset: replace current values with valueeli: eliminate; here value is not applied
- Parameters
poly (Polygons) – A XTGeo Polygons instance
value (float) – Value to add, subtract etc
opname (str) – Name of operation… ‘add’, ‘sub’, etc
inside (bool) – If True do operation inside polygons; else outside. Note that boundary is treated as ‘inside’
Note
This function works only intuitively when using one single polygon in the
polyinstance. When having several polygons the operation is done sequentially per polygon which may lead to surprising results. For instance, using “add inside” into two overlapping polygons, the addition will be doubled in the overlapping part. Similarly using e.g. “eli, outside” will completely remove all points of two non-overlapping polygons are given as input.
-
protected_columns()¶ - Returns
Columns not deleted by
delete_columns(), for instance the coordinate columns.
-
set_inside(poly, value)¶ Set a value (scalar) to points inside polygons.
See notes under
operation_polygons().
-
set_outside(poly, value)¶ Set a value (scalar) to points outside polygons.
See notes under
operation_polygons().
-
snap_surface(surf, activeonly=True)[source]¶ Snap (transfer) the points Z values to a RegularSurface
- Parameters
surf (RegularSurface) – Surface to snap to.
activeonly (bool) – If True (default), the points outside the defined surface will be removed. If False, these points will keep the original values.
- Returns
None (instance is updated inplace)
- Raises
ValueError – Input object of wrong data type, must be RegularSurface
RuntimeError – Error code from C routine surf_get_zv_from_xyv is …
New in version 2.1.
-
sub_inside(poly, value)¶ Subtract a value (scalar) to points inside polygons.
See notes under
operation_polygons().
-
sub_outside(poly, value)¶ Subtract a value (scalar) to points outside polygons.
See notes under
operation_polygons().
-
to_file(pfile, fformat='xyz', attributes=True, pfilter=None, wcolumn=None, hcolumn=None, mdcolumn='M_MDEPTH', **kwargs)[source]¶ Export Points to file.
- Parameters
pfile (str) – Name of file
fformat (str) – File format xyz/poi/pol or rms_attr
attributes (bool or list) – List of extra columns to export (some formats) or True for all attributes present
pfilter (dict) – Filter on e.g. top name(s) with keys TopName or ZoneName as {‘TopName’: [‘Top1’, ‘Top2’]}.
wcolumn (str) – Name of well column (rms_wellpicks format only)
hcolumn (str) – Name of horizons column (rms_wellpicks format only)
mdcolumn (str) – Name of MD column (rms_wellpicks format only)
- Returns
Number of points exported
Note that the rms_wellpicks will try to output to:
HorizonName, WellName, MD if a MD (mdcolumn) is present,
HorizonName, WellName, X, Y, Z otherwise
Note
For backward compatibility, the key
filtercan be applied instead ofpfilter.- Raises
KeyError if pfilter is set and key(s) are invalid –
-
to_roxar(project, name, category, stype='horizons', pfilter=None, realisation=0, attributes=False)[source]¶ Export (store) a Points item to a Roxar RMS project.
The export to the RMS project can be done either within the project or outside the project.
Note also that horizon/zone name and category must exists in advance, otherwise an Exception will be raised.
Note
When project is file path (direct access, outside RMS) then
to_roxar()will implicitly do a project save. Otherwise, the project will not be saved until the user do an explicit project save action.- Parameters
project (str or special) – Name of project (as folder) if outside RMS, og just use the magic project word if within RMS.
name (str) – Name of polygons item
category (str) – For horizons/zones/faults: for example ‘DL_depth’
pfilter (dict) – Filter on e.g. top name(s) with keys TopName or ZoneName as {‘TopName’: [‘Top1’, ‘Top2’]}
stype (str) – RMS folder type, ‘horizons’ (default), ‘zones’ or ‘faults’ or ‘clipboard’, general2d_data (in prep: well picks)
realisation (int) – Realisation number, default is 0
attributes (bool) – If True, attributes will be preserved (from RMS 11)
- Returns
Object instance updated
- Raises
ValueError – Various types of invalid inputs.
NotImplementedError – Not supported in this ROXAPI version
New in version 2.19: general2d_data support is added
-
property
xname¶ Returns or set the name of the X column.
-
property
yname¶ Returns or set the name of the Y column.
-
property
zname¶ Returns or set the name of the Z column.
Polygons
Functions
-
xtgeo.polygons_from_file(pfile, fformat='guess')[source]¶ Make an instance of a Polygons object directly from file import.
Supported formats are:
‘xyz’ or ‘pol’: Simple XYZ format
‘zmap’: ZMAP line format as exported from RMS (e.g. fault lines)
‘guess’: Try to choose file format based on extension
- Parameters
pfile (str) – Name of file
fformat (str) – See
Polygons.from_file()
Example:
import xtgeo
mypoly = xtgeo.polygons_from_file('somefile.xyz')
-
xtgeo.polygons_from_roxar(project, name, category, stype='horizons', realisation=0)[source]¶ Load a Polygons instance from Roxar RMS project.
Note also that horizon/zone/faults name and category must exists in advance, otherwise an Exception will be raised.
- Parameters
project (
Union[str,Any]) – Name of project (as folder) if outside RMS, or just use the magic project word if within RMS.name (
str) – Name of polygons itemcategory (
str) – For horizons/zones/faults: for example ‘DL_depth’ or use a folder notation on clipboard/general2d_data.stype (
Optional[str]) – RMS folder type, ‘horizons’ (default), ‘zones’, ‘clipboard’, ‘faults’, ‘general2d_data’realisation (
Optional[int]) – Realisation number, default is 0
Example:
import xtgeo
mysurf = xtgeo.polygons_from_roxar(project, 'TopAare', 'DepthPolys')
New in version 2.19: general2d_data support is added
-
xtgeo.polygons_from_wells(wells, zone=1, resample=1)[source]¶ Get polygons from wells and a single zone number.
- Parameters
wells (
List[Well]) – List of XTGeo well objects, a single XTGeo well or a list of well files. If a list of well files, the routine will try to load well based on file signature and/or extension, but only default settings are applied. Hence this is less flexible and more fragile.zone (
Optional[int]) – The zone number to extract the linepiece fromresample (
Optional[int]) – If given, resample every N’th sample to make polylines smaller in terms of bits and bytes. 1 = No resampling, which means just use well sampling (which can be rather dense; typically 15 cm).
- Returns
None if empty data, otherwise a Polygons() instance.
Example:
wells = ["w1.w", "w2.w"]
points = xtgeo.polygons_from_wells(wells, zone=2)
Note
This method replaces the deprecated method
from_wells(). The latter returns the number of wells that contribute with polygon segments. This is now implemented through the function get_nwells(). Hence the following code:nwells_applied = poly.from_wells(...) # deprecated method # vs poly = xtgeo.polygons_from_wells(...) nwells_applied = poly.get_nwells()
Classes
-
class
xtgeo.Polygons(values=None, xname='X_UTME', yname='Y_UTMN', zname='Z_TVDSS', pname='POLY_ID', hname='H_CUMLEN', dhname='H_DELTALEN', tname='T_CUMLEN', dtname='T_DELTALEN', name='poly', attributes=None, fformat='guess')[source]¶ Bases:
xtgeo.xyz._xyz.XYZClass for a Polygons object (connected points) in the XTGeo framework.
The term Polygons is here used in a wider context, as it includes polylines that do not connect into closed polygons. A Polygons instance may contain several pieces of polylines/polygons, which are identified by POLY_ID.
The polygons are stored in Python as a Pandas dataframe, which allow for flexible manipulation and fast execution.
A Polygons instance will have 4 mandatory columns; here by default names:
X_UTME - for X UTM coordinate (Easting)
Y_UTMN - For Y UTM coordinate (Northing)
Z_TVDSS - For depth or property from mean SeaLevel; Depth positive down
POLY_ID - for polygon ID as there may be several polylines segments
Each Polygons instance can also a name (through the name attribute). Default is ‘poly’. E.g. if a well fence, it is logical to name the instance to be the same as the well name.
- Parameters
values (
Union[list,ndarray,DataFrame]) – Provide input values on various forms (list-like or dataframe).xname (
str) – Name of first (X) mandatory column, default is X_UTME.yname (
str) – Name of second (Y) mandatory column, default is Y_UTMN.zname (
str) – Name of third (Z) mandatory column, default is Z_TVDSS.pname (
str) – Name of forth (P) mandatory enumerating column, default is POLY_ID.hname (
str) – Name of cumulative horizontal length, defaults to “H_CUMLEN” if in dataframe otherwise None.dhname (
str) – Name of delta horizontal length, defaults to “H_DELTALEN” if in dataframe otherwise None.tname (
str) – Name of cumulative total length, defaults to “T_CUMLEN” if in dataframe otherwise None.dtname (
str) – Name of delta total length, defaults to “T_DELTALEN” if in dataframe otherwise None.attributes (
Optional[dict]) – A dictionary for attribute columns as ‘name: type’, e.g. {“WellName”: “str”, “IX”: “int”}. This is applied when values are input and is to name and type the extra attribute columns in a point set.name (str) –
fformat (str) –
Concrete initialisation for base class _XYZ.
Public Data Attributes:
nameReturns or sets the name of the instance.
pnamehnameReturns or set the name of the cumulative horizontal length.
dhnameReturns or set the name of the delta horizontal length column if it exists.
tnameReturns or set the name of the cumulative total length column if it exists.
dtnameReturns or set the name of the delta total length column if it exists.
dataframeReturns or set the Pandas dataframe object.
Inherited from
XYZxnameReturns or set the name of the X column.
ynameReturns or set the name of the Y column.
znameReturns or set the name of the Z column.
dataframeReturn or set the Pandas dataframe object.
nrowReturns the Pandas dataframe object number of rows.
Public Methods:
boundary_from_points(points[, alpha_factor, …])Instantiate polygons from detecting the boundary around points.
protected_columns()- returns
Columns not deleted by
delete_columns(), for
from_file(pfile[, fformat])Deprecated since version 2.21.
to_file(pfile[, fformat])Export Polygons to file.
from_wells(wells, zone[, resample])Get line segments from a list of wells and a single zone number.
to_roxar(project, name, category[, stype, …])Export (store) a Polygons item to a Roxar RMS project.
copy()Returns a deep copy of an instance
from_list(plist)Deprecated since version 2.16.
get_xyz_dataframe()Get a dataframe copy from the Polygons points with no ID column.
get_shapely_objects()Returns a list of Shapely LineString objects, one per POLY_ID.
get_boundary()Get the square XYZ window (boundaries) of the instance.
simplify([tolerance, preserve_topology])Simply a polygon, i.e. remove unneccesary points.
filter_byid([polyid])Remove all line segments not in polyid.
tlen([tname, dtname, atindex])Compute and add or replace columns for cum.
hlen([hname, dhname, atindex])Compute and add/replace columns for cum.
extend(distance[, nsamples, mode2d])Extend polyline by distance at both ends, nsmaples times.
rescale(distance[, addlen, kind, mode2d])Rescale (resample) by using a new increment.
get_fence([distance, atleast, nextend, …])Extracts a fence with constant horizontal sampling.
quickplot([filename, others, title, …])Simple plotting of polygons using matplotlib.
Inherited from
XYZcopy()Returns a deep copy of an instance
describe([flush])Describe an instance by printing to stdout
from_file(pfile[, fformat])Import Points or Polygons from a file (deprecated).
from_list(plist)Create Points or Polygons from a list-like input (deprecated).
protected_columns()- returns
Columns not deleted by
delete_columns(), for
geometry_columns()- returns
Columns can be deleted silently by
delete_columns()
delete_columns(clist[, strict])Delete one or more columns by name.
get_boundary()Get the square XYZ window (boundaries) of the instance.
operation_polygons(poly, value[, opname, inside])A generic function for operations restricted to inside or outside polygon(s).
add_inside(poly, value)Add a value (scalar) to points inside polygons.
add_outside(poly, value)Add a value (scalar) to points outside polygons.
sub_inside(poly, value)Subtract a value (scalar) to points inside polygons.
sub_outside(poly, value)Subtract a value (scalar) to points outside polygons.
mul_inside(poly, value)Multiply a value (scalar) to points inside polygons.
mul_outside(poly, value)Multiply a value (scalar) to points outside polygons.
div_inside(poly, value)Divide a value (scalar) to points inside polygons.
div_outside(poly, value)Divide a value (scalar) outside polygons (value 0.0 will give result 0).
set_inside(poly, value)Set a value (scalar) to points inside polygons.
set_outside(poly, value)Set a value (scalar) to points outside polygons.
eli_inside(poly)Eliminate current points inside polygons.
eli_outside(poly)Eliminate current points outside polygons.
-
__init__(values=None, xname='X_UTME', yname='Y_UTMN', zname='Z_TVDSS', pname='POLY_ID', hname='H_CUMLEN', dhname='H_DELTALEN', tname='T_CUMLEN', dtname='T_DELTALEN', name='poly', attributes=None, fformat='guess')[source]¶ Concrete initialisation for base class _XYZ.
- Parameters
values (Union[list, numpy.ndarray, pandas.core.frame.DataFrame]) –
xname (str) –
yname (str) –
zname (str) –
pname (str) –
hname (str) –
dhname (str) –
tname (str) –
dtname (str) –
name (str) –
attributes (Optional[dict, None]) –
fformat (str) –
-
add_inside(poly, value)¶ Add a value (scalar) to points inside polygons.
See notes under
operation_polygons().
-
add_outside(poly, value)¶ Add a value (scalar) to points outside polygons.
See notes under
operation_polygons().
-
classmethod
boundary_from_points(points, alpha_factor=1.0, alpha=None, convex=False)[source]¶ Instantiate polygons from detecting the boundary around points.

- Parameters
points – The XTGeo Points instance to estimate boundary/boundaries around.
alpha_factor (
Optional[float]) – The alpha factor is a multiplier to alpha. Normally it will be around 1, but can be increased to get a looser boundary. Dependent on the points topology, it can also be decreased to some extent.alpha (
Optional[float]) – The alpha factor for determine the ‘precision’ in how to delineate the polygon. A large value will produce a smoother polygon. The default is to detect the value from the data, but note that this default may be far from optimal for you needs. Usually use thealpha_factorto tune the best value. The actual alpha applied in the concave hull algorithm is alpha_factor multiplied with alpha.convex (
bool) – If True, then compute a maximum boundary (convex), and note that alpha_factor and alpha are not applied in ths case. Default is False.
- Returns
A Polygons instance.
-
property
dataframe¶ Returns or set the Pandas dataframe object.
- Return type
DataFrame
-
delete_columns(clist, strict=False)¶ Delete one or more columns by name.
Note that the columns returned by
protected_columns(self)()(for instance, the coordinate columns) will not be deleted.- Parameters
self (obj) – Points or Polygons
clist (list) – Name of columns
strict (bool) – I False, will not trigger exception if a column is not found. Otherways a ValueError will be raised.
- Raises
ValueError – If strict is True and columnname not present
- Example::
mypoly.delete_columns([“WELL_ID”, mypoly.hname, mypoly.dhname])
New in version 2.1.
-
describe(flush=True)¶ Describe an instance by printing to stdout
-
property
dhname¶ Returns or set the name of the delta horizontal length column if it exists.
If the column does not exist, None is returned. Default name is H_DELTALEN.
New in version 2.1.
-
div_inside(poly, value)¶ Divide a value (scalar) to points inside polygons.
See notes under
operation_polygons().
-
div_outside(poly, value)¶ Divide a value (scalar) outside polygons (value 0.0 will give result 0).
See notes under
operation_polygons().
-
property
dtname¶ Returns or set the name of the delta total length column if it exists.
New in version 2.1.
-
eli_inside(poly)¶ Eliminate current points inside polygons.
See notes under
operation_polygons().
-
eli_outside(poly)¶ Eliminate current points outside polygons.
See notes under
operation_polygons().
-
extend(distance, nsamples=1, mode2d=True)[source]¶ Extend polyline by distance at both ends, nsmaples times.
The instance is updated in-place.
- Parameters
distance (float) – The horizontal distance (sampling) to extend
nsamples (int) – Number of samples to extend.
mode2d (bool) – XY extension (only True is supported)
New in version 2.1.
-
filter_byid(polyid=None)[source]¶ Remove all line segments not in polyid.
The instance is updated in-place.
- Parameters
polyid (int or list of int) – Which ID(s) to keep, None means use first.
Example:
mypoly.filter_byid(polyid=[2, 4]) # keep POLY_ID 2 and 4
New in version 2.1.
-
from_file(pfile, fformat='xyz')[source]¶ Deprecated since version 2.21: This will be removed in 4.0. Use xtgeo.polygons_from_file() instead
-
from_list(plist)[source]¶ Deprecated since version 2.16: This will be removed in 4.0. Use direct Polygons() initialisation instead
-
from_wells(wells, zone, resample=1)[source]¶ Get line segments from a list of wells and a single zone number.
- Parameters
wells (list) – List of XTGeo well objects
zone (int) – Which zone to apply
resample (int) – If given, resample every N’th sample to make polylines smaller in terms of bits and bytes. 1 = No resampling which means well sampling (which can be rather dense; typically 15 cm).
- Returns
None if well list is empty; otherwise the number of wells that have one or more line segments to return
Deprecated since version 2.16: This will be removed in 4.0. Use xtgeo.polygons_from_wells(…) instead
-
geometry_columns()¶ - Returns
Columns can be deleted silently by
delete_columns()
-
get_boundary()[source]¶ Get the square XYZ window (boundaries) of the instance.
- Returns
(xmin, xmax, ymin, ymax, zmin, zmax)
See also
The class method
Polygons.boundary_from_points()
-
get_fence(distance=20, atleast=5, nextend=2, name=None, asnumpy=True, polyid=None)[source]¶ Extracts a fence with constant horizontal sampling.
Additonal H_CUMLEN and H_DELTALEN vectors will be added, suitable for X sections.
- Parameters
distance (float) – New horizontal distance between points
atleast (int) – Minimum number of points. If the true length/atleast is less than distance, than distance will be be reset to length/atleast. Values below 3 are not permitted
nextend (int) – Number of samples to extend at each end. Note that in case of internal resetting of distance (due to ‘atleast’), then nextend internally will be modified in order to fulfill the initial intention. Hence keep distance*nextend as target.
name (str) – Name of polygon (if asnumpy=False)
asnumpy (bool) – Return a [:, 5] numpy array with columns X.., Y.., Z.., HLEN, dH
polyid (int) – Which POLY_ID to use. Default (if None) is to use the first found.
- Returns
A numpy array (if asnumpy=True) or a new Polygons() object
New in version 2.1.
-
get_shapely_objects()[source]¶ Returns a list of Shapely LineString objects, one per POLY_ID.
New in version 2.1.
-
get_xyz_dataframe()[source]¶ Get a dataframe copy from the Polygons points with no ID column.
Convert from POLY_ID based to XYZ, where a new polygon is marked with a 999 value as flag.
-
hlen(hname='H_CUMLEN', dhname='H_DELTALEN', atindex=0)[source]¶ Compute and add/replace columns for cum. horizontal length and delta length.
The instance is updated in-place.
- Parameters
hname (str) – Name of cumulative horizontal length. Default is H_CUMLEN.
dhname (str) – Name of delta length column. Default is H_DELTALEN.
atindex (int) – Which index which shall be 0.0 for cumulative length.
New in version 2.1.
-
property
hname¶ Returns or set the name of the cumulative horizontal length.
If the column does not exist, None is returned. Default name is H_CUMLEN.
New in version 2.1.
-
mul_inside(poly, value)¶ Multiply a value (scalar) to points inside polygons.
See notes under
operation_polygons().
-
mul_outside(poly, value)¶ Multiply a value (scalar) to points outside polygons.
See notes under
operation_polygons().
-
property
name¶ Returns or sets the name of the instance.
-
property
nrow¶ Returns the Pandas dataframe object number of rows.
-
operation_polygons(poly, value, opname='add', inside=True)¶ A generic function for operations restricted to inside or outside polygon(s).
The operations are performed on the Z values, while the ‘inside’ or ‘outside’ of polygons are purely based on X and Y values (typically X is East and Y in North coordinates).
The operations are XYZ generic i.e. done on the points that defines the Polygon or the point in Points, depending on the calling instance.
Possible
opnamestrings:add: add the valuesub: substract the valuemul: multiply the valuediv: divide the valueset: replace current values with valueeli: eliminate; here value is not applied
- Parameters
poly (Polygons) – A XTGeo Polygons instance
value (float) – Value to add, subtract etc
opname (str) – Name of operation… ‘add’, ‘sub’, etc
inside (bool) – If True do operation inside polygons; else outside. Note that boundary is treated as ‘inside’
Note
This function works only intuitively when using one single polygon in the
polyinstance. When having several polygons the operation is done sequentially per polygon which may lead to surprising results. For instance, using “add inside” into two overlapping polygons, the addition will be doubled in the overlapping part. Similarly using e.g. “eli, outside” will completely remove all points of two non-overlapping polygons are given as input.
-
protected_columns()[source]¶ - Returns
Columns not deleted by
delete_columns(), for instance the coordinate columns.
-
quickplot(filename=None, others=None, title='QuickPlot for Polygons', subtitle=None, infotext=None, linewidth=1.0, color='r')[source]¶ Simple plotting of polygons using matplotlib.
- Parameters
filename (str) – Name of plot file; None will plot to screen.
others (list of Polygons) – List of other polygon instances to plot
title (str) – Title of plot
subtitle (str) – Subtitle of plot
infotext (str) – Additonal info on plot.
linewidth (float) – Width of line.
color (str) – Name of color (may use matplotib shortcuts, e.g. ‘r’ for ‘red’)
-
rescale(distance, addlen=False, kind='simple', mode2d=True)[source]¶ Rescale (resample) by using a new increment.
The increment (distance) may be a horizontal or a True 3D distance dependent on mode2d.
The instance is updated in-place.
If the distance is larger than the total input poly-line length, nothing is done. Note that the result distance may differ from the requested distance caused to rounding to fit original length.
Hence actual distance is input distance +- 50%.
- Parameters
distance (float) – New distance between points
addlen (str) – If True, total and horizontal cum. and delta length columns will be added.
kind (str) – What kind of rescaling: slinear/cubic/simple
mode2d (bool) – The distance may be a 2D (XY) ora 3D (XYZ) mode.
Changed in version 2.1: a new algorithm
-
set_inside(poly, value)¶ Set a value (scalar) to points inside polygons.
See notes under
operation_polygons().
-
set_outside(poly, value)¶ Set a value (scalar) to points outside polygons.
See notes under
operation_polygons().
-
simplify(tolerance=0.1, preserve_topology=True)[source]¶ Simply a polygon, i.e. remove unneccesary points.
This is based on Shapely’s simplify() method
- Parameters
tolerance (
Optional[float]) – Cf. Shapely’s documentationpreserve_topology (
Optional[bool]) – Default is True, if False a faster algorithm is applied
- Return type
bool- Returns
True if simplification is achieved. The polygons instance is updated in-place.
-
sub_inside(poly, value)¶ Subtract a value (scalar) to points inside polygons.
See notes under
operation_polygons().
-
sub_outside(poly, value)¶ Subtract a value (scalar) to points outside polygons.
See notes under
operation_polygons().
-
tlen(tname='T_CUMLEN', dtname='T_DELTALEN', atindex=0)[source]¶ Compute and add or replace columns for cum. total 3D length and delta length.
The instance is updated in-place.
- Parameters
tname (str) – Name of cumulative total length. Default is T_CUMLEN.
dtname (str) – Name of delta length column. Default is T_DELTALEN.
atindex (int) – Which index which shall be 0.0 for cumulative length.
New in version 2.1.
-
property
tname¶ Returns or set the name of the cumulative total length column if it exists.
New in version 2.1.
-
to_file(pfile, fformat='xyz')[source]¶ Export Polygons to file.
- Parameters
pfile (str) – Name of file
fformat (str) – File format xyz/poi/pol
- Returns
Number of polygon points exported
-
to_roxar(project, name, category, stype='horizons', realisation=0)[source]¶ Export (store) a Polygons item to a Roxar RMS project.
The export to the RMS project can be done either within the project or outside the project.
Note also that horizon/zone name and category must exists in advance, otherwise an Exception will be raised.
Note
When project is file path (direct access, outside RMS) then
to_roxar()will implicitly do a project save. Otherwise, the project will not be saved until the user do an explicit project save action.- Parameters
project (str or special) – Name of project (as folder) if outside RMS, og just use the magic project word if within RMS.
name (str) – Name of polygons item
category (str) – For horizons/zones/faults: for example ‘DL_depth’ and use a folder notation for clipboard/general2d_data
stype (str) – RMS folder type, ‘horizons’ (default), ‘zones’ or ‘faults’ or ‘clipboard’ (in prep: well picks)
realisation (int) – Realisation number, default is 0
- Returns
Object instance updated
- Raises
ValueError – Various types of invalid inputs.
NotImplementedError – Not supported in this ROXAPI version
New in version 2.19: general2d_data support is added
-
property
xname¶ Returns or set the name of the X column.
-
property
yname¶ Returns or set the name of the Y column.
-
property
zname¶ Returns or set the name of the Z column.
Wells
Well (single)
Functions
-
xtgeo.well_from_file(wfile, fformat='rms_ascii', mdlogname=None, zonelogname=None, lognames='all', lognames_strict=False, strict=False)[source]¶ Make an instance of a Well directly from file import.
Note
rms_ascii is the only correct for wells from RMS. Irap did not have this format. For maps and points, the formats from the old Irap tool is applied in RMS, hence “irap_ascii” and “rms_ascii” are there the same.
- Parameters
wfile (
Union[str,Path]) – File path, either a string or a pathlib.Path instancefformat (
Optional[str]) – SeeWell.from_file()mdlogname (
Optional[str]) – Name of Measured Depth log if anyzonelogname (
Optional[str]) – Name of Zonelog, if anylognames (
Union[str,List[str],None]) – Name or list of lognames to import, default is “all”lognames_strict (
Optional[bool]) – If True, all lognames must be present.strict (
Optional[bool]) – If True, then import will fail if zonelogname or mdlogname are asked for but not present in wells.
- Return type
xtgeo.well.well1.Well
Example:
>>> import xtgeo
>>> mywell = xtgeo.well_from_file(well_dir + "/OP_1.w")
Changed in version 2.1: Added
lognamesandlognames_strictChanged in version 2.1:
strictnow defaults to False- Return type
Well- Parameters
wfile (Union[str, pathlib.Path]) –
fformat (Optional[str, None]) –
mdlogname (Optional[str, None]) –
zonelogname (Optional[str, None]) –
lognames (Optional[Union[str, List[str]]]) –
lognames_strict (Optional[bool, None]) –
strict (Optional[bool, None]) –
-
xtgeo.well_from_roxar(project, name, trajectory='Drilled trajectory', logrun='log', lognames='all', lognames_strict=False, inclmd=False, inclsurvey=False)[source]¶ This makes an instance of a Well directly from Roxar RMS.
Note this method works only when inside RMS, or when RMS license is activated.
- Parameters
project (
Union[str,object]) – Path to project or magicprojectvariable in RMS.name (
str) – Name of Well, as shown in RMS.trajectory (
Optional[str]) – Name of trajectory in RMS.logrun (
Optional[str]) – Name of logrun in RMS.lognames (
Union[str,List[str],None]) – List of lognames to import or use ‘all’ for all present logslognames_strict (
Optional[bool]) – If True and log is not in lognames is a list, an Exception will be raised.inclmd (
Optional[bool]) – If True, a Measured Depth log will be included.inclsurvey (
Optional[bool]) – If True, logs for azimuth and deviation will be included.
- Return type
Well- Returns
Well instance.
Example:
# inside RMS:
import xtgeo
mylogs = ['ZONELOG', 'GR', 'Facies']
mywell = xtgeo.well_from_roxar(
    project, "31_3-1", trajectory="Drilled", logrun="log", lognames=mylogs
)
Changed in version 2.1: lognames defaults to “all”, not None
Classes
-
class
xtgeo.Well(rkb, xpos, ypos, wname, df, mdlogname=None, zonelogname=None, wlogtypes=None, wlogrecords=None, filesrc=None)[source]¶ Bases:
objectClass for a well in the XTGeo framework.
The well logs are stored in a Pandas dataframe, which make manipulation easy and fast.
The well trajectory are here represented as logs, and XYZ have magic names:
X_UTME,Y_UTMN,Z_TVDSS, which are the three first Pandas columns.Other geometry logs has also ‘semi-magic’ names:
M_MDEPTH or Q_MDEPTH: Measured depth, either real/true (M_xx) or quasi computed/estimated (Q_xx). The Quasi may be incorrect for all uses, but sufficient for some computations.
Similar for M_INCL, Q_INCL, M_AZI, Q_ASI.
All Pandas values (yes, discrete also!) are currently stored as float64 format, and undefined values are Nan. Integers are stored as Float due to the (historic) lacking support for ‘Integer Nan’. In coming versions, use of
pandas.NA(available from Pandas version 1.0) may be implemented.Note there is a method that can return a dataframe (copy) with Integer and Float columns, see
get_filled_dataframe().The instance can be made either from file or (todo!) by specification:
>>> well1 = Well(well_dir + '/OP_1.w')  # assume RMS ascii well
>>> well2 = Well(well_dir + '/OP_1.w', fformat='rms_ascii')
>>> well3 = xtgeo.well_from_file(well_dir + '/OP_1.w')
- Parameters
rkb (
float) – well RKB heightxpos (
float) – well head X posypos (
float) – well head Y poswname (
str) – well namedf (
DataFrame) – pandas dataframe with log values, expects columns to include ‘X_UTME’, ‘Y_UTMN’, ‘Z_TVDSS’ for x, y and z coordinates. Other columns should be log values.filesrc (
Union[str,Path,None]) – source file if anymdlogname (
str) – Name of Measured Depth log if any.zonelogname (
str) – Name of Zonelog, if anywlogtypes (
Dict[str,str]) – dictionary of log types, ‘DISC’ or ‘CONT’, defaults to to ‘CONT’.wlogrecords (
Dict[str,str]) – dictionary of codes for ‘DISC’ logs, None for no codes given, defaults to None.
Public Data Attributes:
VALID_LOGTYPESmetadataReturn metadata object instance of type MetaDataRegularSurface.
rkbReturns RKB height for the well (read only).
xposReturns well header X position (read only).
yposReturns well header Y position (read only).
wellnameReturns well name, read only.
nameReturns or set (rename) a well name.
wnameReturns or set (rename) a well name.
safewellnameGet well name on syntax safe form; ‘/’ and spaces replaced with ‘_’.
xwellnameSee safewellname.
shortwellnameWell name on a short form where blockname/spaces removed (read only).
truewellnameReturns well name on the assummed form aka ‘31/2-E-4 AH2’.
mdlognameReturns name of MD log, if any (None if missing).
zonelognameReturns or sets name of zone log, return None if missing.
dataframeReturns or set the Pandas dataframe object for all logs.
nrowReturns the Pandas dataframe object number of rows.
ncolReturns the Pandas dataframe object number of columns.
nlogsReturns the Pandas dataframe object number of columns.
lognames_allReturns dataframe column names as list, including mandatory coords.
lognamesReturns the Pandas dataframe column as list excluding coords.
Public Methods:
get_short_wellname(wellname)Well name on a short name form where blockname and spaces are removed.
describe([flush])Describe an instance by printing to stdout.
from_file(wfile[, fformat])Deprecated, see
xtgeo.well_from_file()to_file(wfile[, fformat])Export well to file or memory stream.
from_hdf(wfile)Deprecated, use
xtgeo.well_from_file()to_hdf(wfile[, compression])Export well to HDF based file.
from_roxar(project, name[, trajectory, …])Deprecated, use
xtgeo.well_from_roxar()to_roxar(*args, **kwargs)Export (save/store) a well to a roxar project.
get_wlogs()Get a compound dictionary with well log metadata.
set_wlogs(wlogs)Set a compound dictionary with well log metadata.
isdiscrete(logname)Return True of log is discrete, otherwise False.
copy()Copy a Well instance to a new unique Well instance.
rename_log(lname, newname)Rename a log, e.g.
create_log(lname[, logtype, logrecord, …])Create a new log with initial values.
delete_log(lname)Delete/remove an existing log, or list of logs.
delete_logs(lname)Delete/remove an existing log, or list of logs.
get_logtype(lname)Returns the type of a give log (e.g.
set_logtype(lname, ltype)Sets the type of a give log (e.g.
get_logrecord(lname)Returns the record (dict) of a given log name, None if not exists.
set_logrecord(lname, newdict)Sets the record (dict) of a given discrete log.
get_logrecord_codename(lname, key)Returns the name entry of a log record, for a given key.
get_carray(lname)Returns the C array pointer (via SWIG) for a given log.
get_filled_dataframe([fill_value, …])Fill the Nan’s in the dataframe with real UNDEF values.
create_relative_hlen()Make a relative length of a well, as a log.
geometrics()Compute some well geometrical arrays MD, INCL, AZI, as logs.
truncate_parallel_path(other[, xtol, ytol, …])Truncate the part of the well trajectory that is ~parallel with other.
may_overlap(other)Consider if well overlap in X Y coordinates with other well, True/False.
limit_tvd(tvdmin, tvdmax)Truncate the part of the well that is outside tvdmin, tvdmax.
downsample([interval, keeplast])Downsample by sampling every N’th element (coarsen only).
rescale([delta, tvdrange])Rescale (refine or coarse) by sampling a delta along the trajectory, in MD.
get_polygons([skipname])Return a Polygons object from the well trajectory.
get_fence_polyline([sampling, nextend, …])Return a fence polyline as a numpy array or a Polygons object.
create_surf_distance_log(surf[, name])Make a log that is vertical distance to a regular surface.
report_zonation_holes([threshold])Reports if well has holes in zonation, less or equal to N samples.
get_zonation_points([tops, incl_limit, …])Extract zonation points from Zonelog and make a marker list.
get_zone_interval(zonevalue[, resample, …])Extract the X Y Z ID line (polyline) segment for a given zonevalue.
get_fraction_per_zone(dlogname, dcodes[, …])Get fraction of a discrete parameter, e.g.
mask_shoulderbeds(inputlogs, targetlogs[, …])Mask data around zone boundaries or other discrete log boundaries.
get_surface_picks(surf)Return
Pointsobj where well crosses the surface (horizon picks).make_ijk_from_grid(grid[, grid_id, …])Look through a Grid and add grid I J K as discrete logs.
make_zone_qual_log(zqname)Create a zone quality/indicator (flag) log.
get_gridproperties(gridprops[, grid, prop_id])Look through a Grid and add a set of grid properties as logs.
-
__init__(rkb, xpos, ypos, wname, df, mdlogname=None, zonelogname=None, wlogtypes=None, wlogrecords=None, filesrc=None)[source]¶ Initialize self. See help(type(self)) for accurate signature.
- Parameters
rkb (float) –
xpos (float) –
ypos (float) –
wname (str) –
df (pandas.core.frame.DataFrame) –
mdlogname (str) –
zonelogname (str) –
wlogtypes (Dict[str, str]) –
wlogrecords (Dict[str, str]) –
filesrc (Optional[Union[str, pathlib.Path]]) –
-
create_log(lname, logtype='CONT', logrecord=None, value=0.0, force=True)[source]¶ Create a new log with initial values.
If the logname already exists, it will be silently overwritten, unless the option force=False.
- Parameters
lname (str) – name of new log
logtype (str) – Must be ‘CONT’ (default) or ‘DISC’ (discrete)
logrecord (dict) – A dictionary of key: values for ‘DISC’ logs
value (float) – initia value to set_index
force (bool) – If True, and lname exists, it will be overwritten, if False, no new log will be made. Will return False.
- Returns
True ff a new log is made (either new or force overwrite an existing) or False if the new log already exists, and
force=False.
-
create_relative_hlen()[source]¶ Make a relative length of a well, as a log.
The first well og entry defines zero, then the horizontal length is computed relative to that by simple geometric methods.
-
create_surf_distance_log(surf, name='DIST_SURF')[source]¶ Make a log that is vertical distance to a regular surface.
If the trajectory is above the surface (i.e. more shallow), then the distance sign is positive.
- Parameters
surf (
object) – The RegularSurface instance.name (
Optional[str]) – The name of the new log. If it exists it will be overwritten.
Example:
mywell.rescale()  # optional
thesurf = xtgeo.RegularSurface("some.gri")
mywell.create_surf_distance_log(thesurf, name="sdiff")
-
property
dataframe¶ Returns or set the Pandas dataframe object for all logs.
-
delete_log(lname)[source]¶ Delete/remove an existing log, or list of logs.
Will continue silently if a log does not exist.
- Parameters
lname (str or list) – A logname or a list of lognames
- Returns
Number of logs deleted
-
delete_logs(lname)¶ Delete/remove an existing log, or list of logs.
Will continue silently if a log does not exist.
- Parameters
lname (str or list) – A logname or a list of lognames
- Returns
Number of logs deleted
-
downsample(interval=4, keeplast=True)[source]¶ Downsample by sampling every N’th element (coarsen only).
- Parameters
interval (int) – Sampling interval.
keeplast (bool) – If True, the last element from the original dataframe is kept, to avoid that the well is shortened.
-
from_file(wfile, fformat='rms_ascii', **kwargs)[source]¶ Deprecated, see
xtgeo.well_from_file()Deprecated since version 2.16: This will be removed in 4.0. Use xtgeo.well_from_file() instead
-
from_hdf(wfile)[source]¶ Deprecated, use
xtgeo.well_from_file()- Parameters
wfile (Union[str, pathlib.Path]) –
-
from_roxar(project, name, trajectory='Drilled trajectory', logrun='log', lognames='all', lognames_strict=False, inclmd=False, inclsurvey=False)[source]¶ Deprecated, use
xtgeo.well_from_roxar()Deprecated since version 2.16: This will be removed in 4.0. Use xtgeo.well_from_roxar() instead
- Parameters
project (Union[str, object]) –
name (str) –
trajectory (Optional[str, None]) –
logrun (Optional[str, None]) –
lognames (Optional[Union[str, List[str]]]) –
lognames_strict (Optional[bool, None]) –
inclmd (Optional[bool, None]) –
inclsurvey (Optional[bool, None]) –
-
geometrics()[source]¶ Compute some well geometrical arrays MD, INCL, AZI, as logs.
These are kind of quasi measurements hence the logs will named with a Q in front as Q_MDEPTH, Q_INCL, and Q_AZI.
These logs will be added to the dataframe. If the mdlogname attribute does not exist in advance, it will be set to ‘Q_MDEPTH’.
- Returns
False if geometrics cannot be computed
-
get_carray(lname)[source]¶ Returns the C array pointer (via SWIG) for a given log.
Type conversion is double if float64, int32 if DISC log. Returns None of log does not exist.
-
get_fence_polyline(sampling=20, nextend=2, tvdmin=None, asnumpy=True)[source]¶ Return a fence polyline as a numpy array or a Polygons object.
The result will aim for a regular sampling interval, useful for extracting fence plots (cross-sections).
- Parameters
sampling (float) – Sampling interval i.e. horizonal distance (input)
nextend (int) – Number if sampling to extend; e.g. 2 * 20
tvdmin (float) – Minimum TVD starting point.
as_numpy (bool) – If True, a numpy array, otherwise a Polygons object with 5 columns where the 2 last are HLEN and POLY_ID and the POLY_ID will be set to 0.
- Returns
A numpy array of shape (NLEN, 5) in F order, Or a Polygons object with 5 columns If not possible, return False
Changed in version 2.1: improved algorithm
-
get_filled_dataframe(fill_value=1e+33, fill_value_int=2000000000)[source]¶ Fill the Nan’s in the dataframe with real UNDEF values.
This module returns a copy of the dataframe in the object; it does not change the instance.
Note that DISC logs will be casted to columns with integer as datatype.
- Returns
- A pandas dataframe where Nan er replaces with preset
high XTGeo UNDEF values, or user defined values.
-
get_fraction_per_zone(dlogname, dcodes, zonelist=None, incl_limit=80, count_limit=3, zonelogname=None)[source]¶ Get fraction of a discrete parameter, e.g. a facies, per zone.
It can be constrained by an inclination.
Also, it needs to be evaluated only of ZONE is complete; either INCREASE or DECREASE ; hence a quality flag is made and applied.
- Parameters
dlogname (str) – Name of discrete log, e.g. ‘FACIES’
dnames (list of int) – Codes of facies (or similar) to report for
zonelist (list of int) – Zones to use
incl_limit (float) – Inclination limit for well path.
count_limit (int) – Minimum number of counts required per segment for valid calculations
zonelogname (str) If None, the Well() – applied
- Returns
A pandas dataframe (ready for the xyz/Points class), None if a zonelog is missing or or dlogname is missing, list is zero length for any reason.
-
get_gridproperties(gridprops, grid=('ICELL', 'JCELL', 'KCELL'), prop_id='_model')[source]¶ Look through a Grid and add a set of grid properties as logs.
The name of the logs will …
This can be done to sample model properties along a well.
- Parameters
gridprops (Grid) – A XTGeo GridProperties instance (a collection of properties) or a single GridProperty instance
grid (Grid or tuple) – A XTGeo Grid instance or a reference via tuple. If this is tuple with log names, it states that these logs already contains the gridcell IJK numbering.
prop_id (str) – Add a tag (optional) to the current log name, e.g as PORO_model, where _model is the tag.
- Raises
None –
New in version 2.1.
-
get_logrecord_codename(lname, key)[source]¶ Returns the name entry of a log record, for a given key.
Example:
# get the name for zonelog entry no 4:
zname = well.get_logrecord_codename('ZONELOG', 4)
-
get_polygons(skipname=False)[source]¶ Return a Polygons object from the well trajectory.
- Parameters
skipname (bool) – If True then name column is omitted
New in version 2.1.
Changed in version 2.13: Added skipname key
-
static
get_short_wellname(wellname)[source]¶ Well name on a short name form where blockname and spaces are removed.
This should cope with both North Sea style and Haltenbanken style. E.g.: ‘31/2-G-5 AH’ -> ‘G-5AH’, ‘6472_11-F-23_AH_T2’ -> ‘F-23AHT2’
-
get_surface_picks(surf)[source]¶ Return
Pointsobj where well crosses the surface (horizon picks).There may be several points in the Points() dataframe attribute. Also a
DIRECTIONcolumn will show 1 if surface is penetrated from above, and -1 if penetrated from below.- Parameters
surf (RegularSurface) – The surface instance
- Returns
A
Pointsinstance, or None if no crossing points
New in version 2.8.
-
get_wlogs()[source]¶ Get a compound dictionary with well log metadata.
The result will be an Ordered dict on the form:
{"X_UTME": ["CONT", None], ... "Facies": ["DISC", {1: "BG", 2: "SAND"}]}- Return type
OrderedDict
-
get_zonation_points(tops=True, incl_limit=80, top_prefix='Top', zonelist=None, use_undef=False)[source]¶ Extract zonation points from Zonelog and make a marker list.
Currently it is either ‘Tops’ or ‘Zone’ (thicknesses); default is tops (i.e. tops=True).
The zonelist can be a list of zones, or a tuple with two members specifying first and last member. Note however that the zonation shall be without jumps and increasing. E.g.:
zonelist=(1, 5)  # meaning [1, 2, 3, 4, 5]
# or
zonelist=[1, 2, 3, 4]
# while _not_ legal:
zonelist=[1, 4, 8]
Zone numbers less than 0 are not accepted
- Parameters
tops (bool) – If True then compute tops, else (thickness) points.
incl_limit (float) – If given, and usezone is True, the max angle of inclination to be used as input to zonation points.
top_prefix (str) – As well logs usually have isochore (zone) name, this prefix could be Top, e.g. ‘SO43’ –> ‘TopSO43’
zonelist (list of int or tuple) – Zones to use
use_undef (bool) – If True, then transition from UNDEF is also used.
- Returns
A pandas dataframe (ready for the xyz/Points class), None if a zonelog is missing
-
get_zone_interval(zonevalue, resample=1, extralogs=None)[source]¶ Extract the X Y Z ID line (polyline) segment for a given zonevalue.
- Parameters
zonevalue (int) – The zone value to extract
resample (int) – If given, downsample every N’th sample to make polylines smaller in terms of bit and bytes. 1 = No downsampling.
extralogs (list of str) – List of extra log names to include
- Returns
A pandas dataframe X Y Z ID (ready for the xyz/Polygon class), None if a zonelog is missing or actual zone does dot exist in the well.
-
isdiscrete(logname)[source]¶ Return True of log is discrete, otherwise False.
- Parameters
logname (str) – Name of log to check if discrete or not
New in version 2.2.0.
-
limit_tvd(tvdmin, tvdmax)[source]¶ Truncate the part of the well that is outside tvdmin, tvdmax.
Range will be in tvdmin <= tvd <= tvdmax.
- Parameters
tvdmin (float) – Minimum TVD
tvdmax (float) – Maximum TVD
-
property
lognames¶ Returns the Pandas dataframe column as list excluding coords.
- Type
list
-
property
lognames_all¶ Returns dataframe column names as list, including mandatory coords.
- Type
list
-
make_ijk_from_grid(grid, grid_id='', algorithm=2, activeonly=True)[source]¶ Look through a Grid and add grid I J K as discrete logs.
Note that the the grid counting has base 1 (first row is 1 etc).
By default, log (i.e. column names in the dataframe) will be ICELL, JCELL, KCELL, but you can add a tag (ID) to that name.
- Parameters
grid (Grid) – A XTGeo Grid instance
grid_id (str) – Add a tag (optional) to the current log name
algorithm (int) – Which interbal algorithm to use, default is 2 (expert setting)
activeonly (bool) – If True, only active cells are applied (algorithm 2 only)
- Raises
RuntimeError – ‘Error from C routine, code is …’
Changed in version 2.9: Added keys for and activeonly
-
make_zone_qual_log(zqname)[source]¶ Create a zone quality/indicator (flag) log.
This routine looks through to zone log and flag intervals according to neighbouring zones:
0: Undetermined flag
- 1: Zonelog interval numbering increases,
e.g. for zone 2: 1 1 1 1 2 2 2 2 2 5 5 5 5 5
- 2: Zonelog interval numbering decreases,
e.g. for zone 2: 6 6 6 2 2 2 2 1 1 1
3: Interval is a U turning point, e.g. 0 0 0 2 2 2 1 1 1
4: Interval is a inverse U turning point, 3 3 3 2 2 2 5 5
- 9: Interval is bounded by one or more missing sections,
e.g. 1 1 1 2 2 2 -999 -999
If a log with the name exists, it will be silently replaced
- Parameters
zqname (str) – Name of quality log
-
mask_shoulderbeds(inputlogs, targetlogs, nsamples=2, strict=False)[source]¶ Mask data around zone boundaries or other discrete log boundaries.
This operates on number of samples, hence the actual distance which is masked depends on the sampling interval (ie. count) or on distance measures. Distance measures are TVD (true vertical depth) or MD (measured depth).
- Parameters
inputlogs (
List[str]) – List of input logs, must be of discrete type.targetlogs (
List[str]) – List of logs where mask is applied.nsamples (
Union[int,Dict[str,float],None]) – Number of samples around boundaries to filter, per side, i.e. value 2 means 2 above and 2 below, in total 4 samples. As alternative specify nsamples indirectly with a relative distance, as a dictionary with one record, as {“tvd”: 0.5} or {“md”: 0.7}.strict (
Optional[bool]) – If True, will raise Exception of any of the input or target log names are missing.
- Return type
bool- Returns
- True if any operation has been done. False in case nothing has been done,
e.g. no targetlogs for this particular well and
strictis False.
- Raises
ValueError – Various messages when wrong or inconsistent input.
Example
>>> mywell1 = Well(well_dir + '/OP_1.w')
>>> mywell2 = Well(well_dir + '/OP_2.w')
>>> did_succeed = mywell1.mask_shoulderbeds(["Zonelog", "Facies"], ["Perm"])
>>> did_succeed = mywell2.mask_shoulderbeds(
...     ["Zonelog"],
...     ["Perm"],
...     nsamples={"tvd": 0.8}
... )
-
may_overlap(other)[source]¶ Consider if well overlap in X Y coordinates with other well, True/False.
-
property
mdlogname¶ Returns name of MD log, if any (None if missing).
- Type
str
-
property
metadata¶ Return metadata object instance of type MetaDataRegularSurface.
-
property
name¶ Returns or set (rename) a well name.
-
property
ncol¶ Returns the Pandas dataframe object number of columns.
- Type
int
-
property
nlogs¶ Returns the Pandas dataframe object number of columns.
- Type
int
-
property
nrow¶ Returns the Pandas dataframe object number of rows.
- Type
int
-
report_zonation_holes(threshold=5)[source]¶ Reports if well has holes in zonation, less or equal to N samples.
Zonation may have holes due to various reasons, and usually a few undef samples indicates that something is wrong. This method reports well and start interval of the “holes”
The well shall have zonelog from import (via zonelogname attribute) and preferly a MD log (via mdlogname attribute); however if the latter is not present, a report withou MD values will be present.
- Parameters
threshold (int) – Number of samples (max.) that defines a hole, e.g. 5 means that undef samples in the range [1, 5] (including 5) is applied
- Returns
A Pandas dataframe as a report. None if no list is made.
- Raises
RuntimeError if zonelog is not present –
-
rescale(delta=0.15, tvdrange=None)[source]¶ Rescale (refine or coarse) by sampling a delta along the trajectory, in MD.
- Parameters
delta (float) – Step length
tvdrange (tuple of floats) – Resampling can be limited to TVD interval
Changed in version 2.2: Added tvdrange
-
property
rkb¶ Returns RKB height for the well (read only).
-
property
safewellname¶ Get well name on syntax safe form; ‘/’ and spaces replaced with ‘_’.
-
set_wlogs(wlogs)[source]¶ Set a compound dictionary with well log metadata.
This operation is somewhat risky as it may lead to inconsistency, so use with care! Typically, one will use
get_wlogs()first and then modify some attributes.- Parameters
wlogs (
OrderedDict) – Input data dictionary- Raises
ValueError – Invalid log type found in input:
ValueError – Invalid log record found in input:
ValueError – Invalid input key found:
ValueError – Invalid log record found in input:
-
property
shortwellname¶ Well name on a short form where blockname/spaces removed (read only).
This should cope with both North Sea style and Haltenbanken style.
E.g.: ‘31/2-G-5 AH’ -> ‘G-5AH’, ‘6472_11-F-23_AH_T2’ -> ‘F-23AHT2’
- Type
str
-
to_file(wfile, fformat='rms_ascii')[source]¶ Export well to file or memory stream.
- Parameters
wfile (
Union[str,Path,BytesIO]) – File name or stream.fformat (
Optional[str]) – File format (‘rms_ascii’/’rmswell’, ‘hdf/hdf5/h5’).
Example:
>>> xwell = Well(well_dir + '/OP_1.w')
>>> xwell.dataframe['Poro'] += 0.1
>>> filename = xwell.to_file(outdir + "/somefile_copy.rmswell")
-
to_hdf(wfile, compression='lzf')[source]¶ Export well to HDF based file.
Warning
This implementation is currently experimental and only recommended for testing.
- Parameters
wfile (
Union[str,Path]) – HDF File name to write to export to.compression (Optional[str, None]) –
- Return type
Path- Returns
A Path instance to actual file applied.
New in version 2.14.
-
to_roxar(*args, **kwargs)[source]¶ Export (save/store) a well to a roxar project.
Note this method works only when inside RMS, or when RMS license is activated.
The current implementation will either update existing well names (then well log array size must not change), or it will make a new well in RMS.
Note
When project is file path (direct access, outside RMS) then
to_roxar()will implicitly do a project save. Otherwise, the project will not be saved until the user do an explicit project save action.- Parameters
project (str) – Magic string ‘project’ or file path to project
wname (str) – Name of well, as shown in RMS.
( (lognames) – obj:list or :obj:str): List of lognames to save, or use simply ‘all’ for current logs for this well. Default is ‘all’
realisation (int) – Currently inactive
trajectory (str) – Name of trajectory in RMS
logrun (str) – Name of logrun in RMS
New in version 2.12.
Changed in version 2.15: Saving to new wells enabled (earlier only modifying existing)
-
property
truewellname¶ Returns well name on the assummed form aka ‘31/2-E-4 AH2’.
-
truncate_parallel_path(other, xtol=None, ytol=None, ztol=None, itol=None, atol=None)[source]¶ Truncate the part of the well trajectory that is ~parallel with other.
- Parameters
other (Well) – Other well to compare with
xtol (float) – Tolerance in X (East) coord for measuring unit
ytol (float) – Tolerance in Y (North) coord for measuring unit
ztol (float) – Tolerance in Z (TVD) coord for measuring unit
itol (float) – Tolerance in inclination (degrees)
atol (float) – Tolerance in azimuth (degrees)
-
property
wellname¶ Returns well name, read only.
- Type
str
-
property
wname¶ Returns or set (rename) a well name.
-
property
xpos¶ Returns well header X position (read only).
-
property
xwellname¶ See safewellname.
-
property
ypos¶ Returns well header Y position (read only).
- Return type
float
-
property
zonelogname¶ Returns or sets name of zone log, return None if missing.
- Type
str
Wells (multiple)
Classes
-
class
xtgeo.Wells(wells=None)[source]¶ Bases:
objectClass for a collection of Well objects, for operations that involves a number of wells.
See also the
xtgeo.well.Wellclass.- Parameters
wells (
List[Well]) – The list of Well objects.
Public Data Attributes:
namesReturns a list of well names (read only).
wellsReturns or sets a list of XTGeo Well objects, None if empty.
Public Methods:
describe([flush])Describe an instance by printing to stdout
copy()Copy a Wells instance to a new unique instance (a deep copy).
get_well(name)Get a Well() instance by name, or None
from_files(filelist[, fformat, mdlogname, …])Deprecated see
wells_from_files()from_roxar(*args, **kwargs)Import (retrieve) all wells (or based on a filter) from roxar project.
get_dataframe([filled, fill_value1, fill_value2])Get a big dataframe for all wells or blocked wells in instance, with well name as first column
quickplot([filename, title])Fast plot of wells using matplotlib.
limit_tvd(tvdmin, tvdmax)Limit TVD to be in range tvdmin, tvdmax for all wells
downsample([interval, keeplast])Downsample by sampling every N’th element (coarsen only), all wells.
wellintersections([wfilter, showprogress])Get intersections between wells, return as dataframe table.
-
__init__(wells=None)[source]¶ Initialize self. See help(type(self)) for accurate signature.
- Parameters
wells (List[xtgeo.well.well1.Well]) –
-
downsample(interval=4, keeplast=True)[source]¶ Downsample by sampling every N’th element (coarsen only), all wells.
-
from_files(filelist, fformat='rms_ascii', mdlogname=None, zonelogname=None, strict=True, append=True)[source]¶ Deprecated see
wells_from_files()Deprecated since version 2.16: This will be removed in 4.0. Use xtgeo.wells_from_files() instead
-
from_roxar(*args, **kwargs)[source]¶ Import (retrieve) all wells (or based on a filter) from roxar project.
Note this method works only when inside RMS, or when RMS license is activated.
All the wells present in the bwname icon will be imported.
- Parameters
project (str) – Magic string ‘project’ or file path to project
lognames (list) – List of lognames to include, or use ‘all’ for all current blocked logs for this well.
wfilter (str) – This is a regular expression to tell which wells that shall be included.
ijk (bool) – If True, then logs with grid IJK as I_INDEX, etc
realisation (int) – Realisation index (0 is default)
Example:
import xtgeo
mywells = xtgeo.Wells()
mywells.from_roxar(project, lognames='all', wfilter='31.*')
-
get_dataframe(filled=False, fill_value1=- 999, fill_value2=- 9999)[source]¶ Get a big dataframe for all wells or blocked wells in instance, with well name as first column
- Parameters
filled (bool) – If True, then NaN’s are replaces with values
fill_value1 (int) – Only applied if filled=True, for logs that have missing values
fill_value2 (int) – Only applied if filled=True, when logs are missing completely for that well.
-
property
names¶ Returns a list of well names (read only).
Example:
namelist = wells.names
for prop in namelist:
    print ('Well name is {}'.format(name))
-
quickplot(filename=None, title='QuickPlot')[source]¶ Fast plot of wells using matplotlib.
- Parameters
filename (str) – Name of plot file; None will plot to screen.
title (str) – Title of plot
-
wellintersections(wfilter=None, showprogress=False)[source]¶ Get intersections between wells, return as dataframe table.
Notes on wfilter: A wfilter is settings to improve result. In particular to remove parts of trajectories that are parallel.
- wfilter = {‘parallel’: {‘xtol’: 4.0, ‘ytol’: 4.0, ‘ztol’:2.0,
‘itol’:10, ‘atol’:2}}
Here xtol is tolerance in X coordinate; further Y tolerance, Z tolerance, (I)nclination tolerance, and (A)zimuth tolerance.
- Parameters
tvdrange (tuple of floats) – Search interval. One is often just interested in the reservoir section.
wfilter (dict) – A dictionrary for filter options, in order to improve result. See example above.
showprogress (bool) – Will show progress to screen if enabled.
- Returns
- A Pandas dataframe object, with columns WELL, CWELL and UTMX UTMY
TVD coordinates for CWELL where CWELL crosses WELL, and also MDEPTH for the WELL.
-
property
wells¶ Returns or sets a list of XTGeo Well objects, None if empty.
Blocked well (single)
Functions
-
xtgeo.blockedwell_from_file(bwfile, fformat='rms_ascii', mdlogname=None, zonelogname=None, strict=False)[source]¶ Make an instance of a BlockedWell directly from file import.
- Parameters
bmfile (str) – Name of file
fformat (str) – See
Well.from_file()mdlogname (str) – See
Well.from_file()zonelogname (str) – See
Well.from_file()strict (bool) – See
Well.from_file()
Example:
>>> import xtgeo
>>> well3 = xtgeo.blockedwell_from_file(well_dir + '/OP_1.bw')
-
xtgeo.blockedwell_from_roxar(project, gname, bwname, wname, lognames=None, ijk=True)[source]¶ This makes an instance of a BlockedWell directly from Roxar RMS.
For arguments, see
BlockedWell.from_roxar().Example:
# inside RMS:
import xtgeo
mylogs = ['ZONELOG', 'GR', 'Facies']
mybw = xtgeo.blockedwell_from_roxar(project, 'Simgrid', 'BW', '31_3-1',
                                    lognames=mylogs)
Classes
-
class
xtgeo.BlockedWell(*args, **kwargs)[source]¶ Bases:
xtgeo.well.well1.WellClass for a blocked well in the XTGeo framework, subclassed from the Well class.
Similar to Wells, the blocked well logs are stored as Pandas dataframe, which make manipulation easy and fast.
For blocked well logs, the numbers of rows cannot be changed if you want to save the result in RMS, as this is derived from the grid. Also the blocked well icon must exist before save.
The well trajectory are here represented as logs, and XYZ have magic names: X_UTME, Y_UTMN, Z_TVDSS, which are the three first Pandas columns.
Other geometry logs has also ‘semi-magic’ names:
M_MDEPTH or Q_MDEPTH: Measured depth, either real/true (M…) or quasi computed/estimated (Q…). The Quasi may be incorrect for all uses, but sufficient for some computations.
Similar for M_INCL, Q_INCL, M_AZI, Q_ASI.
I_INDEX, J_INDEX, K_INDEX: They are grid indices. For practical reasons they are treated as a CONT logs, since the min/max grid indices usually are unknown, and hence making a code index is not trivial.
All Pandas values (yes, discrete also!) are stored as float64 format, and undefined values are Nan. Integers are stored as Float due to the lacking support for ‘Integer Nan’ (currently lacking in Pandas, but may come in later Pandas versions).
Note there is a method that can return a dataframe (copy) with Integer and Float columns, see
get_filled_dataframe().The instance can be made either from file or:
>>> well1 = BlockedWell(well_dir + '/OP_1.bw')  # assume RMS ascii well
>>> well2 = BlockedWell(well_dir + '/OP_1.bw', fformat='rms_ascii')
>>> well3 = xtgeo.blockedwell_from_file(well_dir + '/OP_1.bw')
If in RMS, instance can be made also from RMS icon:
well4 = xtgeo.blockedwell_from_roxar(
    project,
    'gridname',
    'bwname',
    'wellname',
)
For arguments, see method under
from_file().Public Data Attributes:
VALID_LOGTYPESgridnameReturns or set (rename) the grid name that the blocked wells belongs to.
Inherited from
WellVALID_LOGTYPESmetadataReturn metadata object instance of type MetaDataRegularSurface.
rkbReturns RKB height for the well (read only).
xposReturns well header X position (read only).
yposReturns well header Y position (read only).
wellnameReturns well name, read only.
nameReturns or set (rename) a well name.
wnameReturns or set (rename) a well name.
safewellnameGet well name on syntax safe form; ‘/’ and spaces replaced with ‘_’.
xwellnameSee safewellname.
shortwellnameWell name on a short form where blockname/spaces removed (read only).
truewellnameReturns well name on the assummed form aka ‘31/2-E-4 AH2’.
mdlognameReturns name of MD log, if any (None if missing).
zonelognameReturns or sets name of zone log, return None if missing.
dataframeReturns or set the Pandas dataframe object for all logs.
nrowReturns the Pandas dataframe object number of rows.
ncolReturns the Pandas dataframe object number of columns.
nlogsReturns the Pandas dataframe object number of columns.
lognames_allReturns dataframe column names as list, including mandatory coords.
lognamesReturns the Pandas dataframe column as list excluding coords.
Public Methods:
copy()Copy a Well instance to a new unique Well instance.
from_roxar(*args, **kwargs)Import (retrieve) a single blocked well from roxar project.
to_roxar(*args, **kwargs)Set (export) a single blocked well item inside roxar project.
Inherited from
Wellget_short_wellname(wellname)Well name on a short name form where blockname and spaces are removed.
describe([flush])Describe an instance by printing to stdout.
from_file(wfile[, fformat])Deprecated, see
xtgeo.well_from_file()to_file(wfile[, fformat])Export well to file or memory stream.
from_hdf(wfile)Deprecated, use
xtgeo.well_from_file()to_hdf(wfile[, compression])Export well to HDF based file.
from_roxar(project, name[, trajectory, …])Deprecated, use
xtgeo.well_from_roxar()to_roxar(*args, **kwargs)Export (save/store) a well to a roxar project.
get_wlogs()Get a compound dictionary with well log metadata.
set_wlogs(wlogs)Set a compound dictionary with well log metadata.
isdiscrete(logname)Return True of log is discrete, otherwise False.
copy()Copy a Well instance to a new unique Well instance.
rename_log(lname, newname)Rename a log, e.g.
create_log(lname[, logtype, logrecord, …])Create a new log with initial values.
delete_log(lname)Delete/remove an existing log, or list of logs.
delete_logs(lname)Delete/remove an existing log, or list of logs.
get_logtype(lname)Returns the type of a give log (e.g.
set_logtype(lname, ltype)Sets the type of a give log (e.g.
get_logrecord(lname)Returns the record (dict) of a given log name, None if not exists.
set_logrecord(lname, newdict)Sets the record (dict) of a given discrete log.
get_logrecord_codename(lname, key)Returns the name entry of a log record, for a given key.
get_carray(lname)Returns the C array pointer (via SWIG) for a given log.
get_filled_dataframe([fill_value, …])Fill the Nan’s in the dataframe with real UNDEF values.
create_relative_hlen()Make a relative length of a well, as a log.
geometrics()Compute some well geometrical arrays MD, INCL, AZI, as logs.
truncate_parallel_path(other[, xtol, ytol, …])Truncate the part of the well trajectory that is ~parallel with other.
may_overlap(other)Consider if well overlap in X Y coordinates with other well, True/False.
limit_tvd(tvdmin, tvdmax)Truncate the part of the well that is outside tvdmin, tvdmax.
downsample([interval, keeplast])Downsample by sampling every N’th element (coarsen only).
rescale([delta, tvdrange])Rescale (refine or coarse) by sampling a delta along the trajectory, in MD.
get_polygons([skipname])Return a Polygons object from the well trajectory.
get_fence_polyline([sampling, nextend, …])Return a fence polyline as a numpy array or a Polygons object.
create_surf_distance_log(surf[, name])Make a log that is vertical distance to a regular surface.
report_zonation_holes([threshold])Reports if well has holes in zonation, less or equal to N samples.
get_zonation_points([tops, incl_limit, …])Extract zonation points from Zonelog and make a marker list.
get_zone_interval(zonevalue[, resample, …])Extract the X Y Z ID line (polyline) segment for a given zonevalue.
get_fraction_per_zone(dlogname, dcodes[, …])Get fraction of a discrete parameter, e.g.
mask_shoulderbeds(inputlogs, targetlogs[, …])Mask data around zone boundaries or other discrete log boundaries.
get_surface_picks(surf)Return
Pointsobj where well crosses the surface (horizon picks).make_ijk_from_grid(grid[, grid_id, …])Look through a Grid and add grid I J K as discrete logs.
make_zone_qual_log(zqname)Create a zone quality/indicator (flag) log.
get_gridproperties(gridprops[, grid, prop_id])Look through a Grid and add a set of grid properties as logs.
-
create_log(lname, logtype='CONT', logrecord=None, value=0.0, force=True)¶ Create a new log with initial values.
If the logname already exists, it will be silently overwritten, unless the option force=False.
- Parameters
lname (str) – name of new log
logtype (str) – Must be ‘CONT’ (default) or ‘DISC’ (discrete)
logrecord (dict) – A dictionary of key: values for ‘DISC’ logs
value (float) – initia value to set_index
force (bool) – If True, and lname exists, it will be overwritten, if False, no new log will be made. Will return False.
- Returns
True ff a new log is made (either new or force overwrite an existing) or False if the new log already exists, and
force=False.
-
create_relative_hlen()¶ Make a relative length of a well, as a log.
The first well og entry defines zero, then the horizontal length is computed relative to that by simple geometric methods.
-
create_surf_distance_log(surf, name='DIST_SURF')¶ Make a log that is vertical distance to a regular surface.
If the trajectory is above the surface (i.e. more shallow), then the distance sign is positive.
- Parameters
surf (
object) – The RegularSurface instance.name (
Optional[str]) – The name of the new log. If it exists it will be overwritten.
Example:
mywell.rescale()  # optional
thesurf = xtgeo.RegularSurface("some.gri")
mywell.create_surf_distance_log(thesurf, name="sdiff")
-
property
dataframe¶ Returns or set the Pandas dataframe object for all logs.
-
delete_log(lname)¶ Delete/remove an existing log, or list of logs.
Will continue silently if a log does not exist.
- Parameters
lname (str or list) – A logname or a list of lognames
- Returns
Number of logs deleted
-
delete_logs(lname)¶ Delete/remove an existing log, or list of logs.
Will continue silently if a log does not exist.
- Parameters
lname (str or list) – A logname or a list of lognames
- Returns
Number of logs deleted
-
describe(flush=True)¶ Describe an instance by printing to stdout.
-
downsample(interval=4, keeplast=True)¶ Downsample by sampling every N’th element (coarsen only).
- Parameters
interval (int) – Sampling interval.
keeplast (bool) – If True, the last element from the original dataframe is kept, to avoid that the well is shortened.
-
from_file(wfile, fformat='rms_ascii', **kwargs)¶ Deprecated, see
xtgeo.well_from_file()Deprecated since version 2.16: This will be removed in 4.0. Use xtgeo.well_from_file() instead
-
from_hdf(wfile)¶ Deprecated, use
xtgeo.well_from_file()- Parameters
wfile (Union[str, pathlib.Path]) –
-
from_roxar(*args, **kwargs)[source]¶ Import (retrieve) a single blocked well from roxar project.
Note this method works only when inside RMS, or when RMS license is activated.
- Parameters
project (str) – Magic string project or file path to project
gname (str) – Name of GridModel icon in RMS
bwname (str) – Name of Blocked Well icon in RMS, usually ‘BW’
wname (str) – Name of well, as shown in RMS.
lognames (list) – List of lognames to include, or use ‘all’ for all current blocked logs for this well. Default is ‘all’.
realisation (int) – Realisation index (0 is default)
ijk (bool) – If True, then make additional logs with grid IJK as I_INDEX, etc, default is False
Deprecated since version 2.16: This will be removed in 4.0. Use xtgeo.blockedwell_from_roxar() instead
-
geometrics()¶ Compute some well geometrical arrays MD, INCL, AZI, as logs.
These are kind of quasi measurements hence the logs will named with a Q in front as Q_MDEPTH, Q_INCL, and Q_AZI.
These logs will be added to the dataframe. If the mdlogname attribute does not exist in advance, it will be set to ‘Q_MDEPTH’.
- Returns
False if geometrics cannot be computed
-
get_carray(lname)¶ Returns the C array pointer (via SWIG) for a given log.
Type conversion is double if float64, int32 if DISC log. Returns None of log does not exist.
-
get_fence_polyline(sampling=20, nextend=2, tvdmin=None, asnumpy=True)¶ Return a fence polyline as a numpy array or a Polygons object.
The result will aim for a regular sampling interval, useful for extracting fence plots (cross-sections).
- Parameters
sampling (float) – Sampling interval i.e. horizonal distance (input)
nextend (int) – Number if sampling to extend; e.g. 2 * 20
tvdmin (float) – Minimum TVD starting point.
as_numpy (bool) – If True, a numpy array, otherwise a Polygons object with 5 columns where the 2 last are HLEN and POLY_ID and the POLY_ID will be set to 0.
- Returns
A numpy array of shape (NLEN, 5) in F order, Or a Polygons object with 5 columns If not possible, return False
Changed in version 2.1: improved algorithm
-
get_filled_dataframe(fill_value=1e+33, fill_value_int=2000000000)¶ Fill the Nan’s in the dataframe with real UNDEF values.
This module returns a copy of the dataframe in the object; it does not change the instance.
Note that DISC logs will be casted to columns with integer as datatype.
- Returns
- A pandas dataframe where Nan er replaces with preset
high XTGeo UNDEF values, or user defined values.
-
get_fraction_per_zone(dlogname, dcodes, zonelist=None, incl_limit=80, count_limit=3, zonelogname=None)¶ Get fraction of a discrete parameter, e.g. a facies, per zone.
It can be constrained by an inclination.
Also, it needs to be evaluated only of ZONE is complete; either INCREASE or DECREASE ; hence a quality flag is made and applied.
- Parameters
dlogname (str) – Name of discrete log, e.g. ‘FACIES’
dnames (list of int) – Codes of facies (or similar) to report for
zonelist (list of int) – Zones to use
incl_limit (float) – Inclination limit for well path.
count_limit (int) – Minimum number of counts required per segment for valid calculations
zonelogname (str) If None, the Well() – applied
- Returns
A pandas dataframe (ready for the xyz/Points class), None if a zonelog is missing or or dlogname is missing, list is zero length for any reason.
-
get_gridproperties(gridprops, grid=('ICELL', 'JCELL', 'KCELL'), prop_id='_model')¶ Look through a Grid and add a set of grid properties as logs.
The name of the logs will …
This can be done to sample model properties along a well.
- Parameters
gridprops (Grid) – A XTGeo GridProperties instance (a collection of properties) or a single GridProperty instance
grid (Grid or tuple) – A XTGeo Grid instance or a reference via tuple. If this is tuple with log names, it states that these logs already contains the gridcell IJK numbering.
prop_id (str) – Add a tag (optional) to the current log name, e.g as PORO_model, where _model is the tag.
- Raises
None –
New in version 2.1.
-
get_logrecord(lname)¶ Returns the record (dict) of a given log name, None if not exists.
-
get_logrecord_codename(lname, key)¶ Returns the name entry of a log record, for a given key.
Example:
# get the name for zonelog entry no 4:
zname = well.get_logrecord_codename('ZONELOG', 4)
-
get_logtype(lname)¶ Returns the type of a give log (e.g. DISC or CONT).
-
get_polygons(skipname=False)¶ Return a Polygons object from the well trajectory.
- Parameters
skipname (bool) – If True then name column is omitted
New in version 2.1.
Changed in version 2.13: Added skipname key
-
static
get_short_wellname(wellname)¶ Well name on a short name form where blockname and spaces are removed.
This should cope with both North Sea style and Haltenbanken style. E.g.: ‘31/2-G-5 AH’ -> ‘G-5AH’, ‘6472_11-F-23_AH_T2’ -> ‘F-23AHT2’
-
get_surface_picks(surf)¶ Return
Pointsobj where well crosses the surface (horizon picks).There may be several points in the Points() dataframe attribute. Also a
DIRECTIONcolumn will show 1 if surface is penetrated from above, and -1 if penetrated from below.- Parameters
surf (RegularSurface) – The surface instance
- Returns
A
Pointsinstance, or None if no crossing points
New in version 2.8.
-
get_wlogs()¶ Get a compound dictionary with well log metadata.
The result will be an Ordered dict on the form:
{"X_UTME": ["CONT", None], ... "Facies": ["DISC", {1: "BG", 2: "SAND"}]}- Return type
OrderedDict
-
get_zonation_points(tops=True, incl_limit=80, top_prefix='Top', zonelist=None, use_undef=False)¶ Extract zonation points from Zonelog and make a marker list.
Currently it is either ‘Tops’ or ‘Zone’ (thicknesses); default is tops (i.e. tops=True).
The zonelist can be a list of zones, or a tuple with two members specifying first and last member. Note however that the zonation shall be without jumps and increasing. E.g.:
zonelist=(1, 5)  # meaning [1, 2, 3, 4, 5]
# or
zonelist=[1, 2, 3, 4]
# while _not_ legal:
zonelist=[1, 4, 8]
Zone numbers less than 0 are not accepted
- Parameters
tops (bool) – If True then compute tops, else (thickness) points.
incl_limit (float) – If given, and usezone is True, the max angle of inclination to be used as input to zonation points.
top_prefix (str) – As well logs usually have isochore (zone) name, this prefix could be Top, e.g. ‘SO43’ –> ‘TopSO43’
zonelist (list of int or tuple) – Zones to use
use_undef (bool) – If True, then transition from UNDEF is also used.
- Returns
A pandas dataframe (ready for the xyz/Points class), None if a zonelog is missing
-
get_zone_interval(zonevalue, resample=1, extralogs=None)¶ Extract the X Y Z ID line (polyline) segment for a given zonevalue.
- Parameters
zonevalue (int) – The zone value to extract
resample (int) – If given, downsample every N’th sample to make polylines smaller in terms of bit and bytes. 1 = No downsampling.
extralogs (list of str) – List of extra log names to include
- Returns
A pandas dataframe X Y Z ID (ready for the xyz/Polygon class), None if a zonelog is missing or actual zone does dot exist in the well.
-
property
gridname¶ Returns or set (rename) the grid name that the blocked wells belongs to.
-
isdiscrete(logname)¶ Return True of log is discrete, otherwise False.
- Parameters
logname (str) – Name of log to check if discrete or not
New in version 2.2.0.
-
limit_tvd(tvdmin, tvdmax)¶ Truncate the part of the well that is outside tvdmin, tvdmax.
Range will be in tvdmin <= tvd <= tvdmax.
- Parameters
tvdmin (float) – Minimum TVD
tvdmax (float) – Maximum TVD
-
property
lognames¶ Returns the Pandas dataframe column as list excluding coords.
- Type
list
-
property
lognames_all¶ Returns dataframe column names as list, including mandatory coords.
- Type
list
-
make_ijk_from_grid(grid, grid_id='', algorithm=2, activeonly=True)¶ Look through a Grid and add grid I J K as discrete logs.
Note that the the grid counting has base 1 (first row is 1 etc).
By default, log (i.e. column names in the dataframe) will be ICELL, JCELL, KCELL, but you can add a tag (ID) to that name.
- Parameters
grid (Grid) – A XTGeo Grid instance
grid_id (str) – Add a tag (optional) to the current log name
algorithm (int) – Which interbal algorithm to use, default is 2 (expert setting)
activeonly (bool) – If True, only active cells are applied (algorithm 2 only)
- Raises
RuntimeError – ‘Error from C routine, code is …’
Changed in version 2.9: Added keys for and activeonly
-
make_zone_qual_log(zqname)¶ Create a zone quality/indicator (flag) log.
This routine looks through to zone log and flag intervals according to neighbouring zones:
0: Undetermined flag
- 1: Zonelog interval numbering increases,
e.g. for zone 2: 1 1 1 1 2 2 2 2 2 5 5 5 5 5
- 2: Zonelog interval numbering decreases,
e.g. for zone 2: 6 6 6 2 2 2 2 1 1 1
3: Interval is a U turning point, e.g. 0 0 0 2 2 2 1 1 1
4: Interval is a inverse U turning point, 3 3 3 2 2 2 5 5
- 9: Interval is bounded by one or more missing sections,
e.g. 1 1 1 2 2 2 -999 -999
If a log with the name exists, it will be silently replaced
- Parameters
zqname (str) – Name of quality log
-
mask_shoulderbeds(inputlogs, targetlogs, nsamples=2, strict=False)¶ Mask data around zone boundaries or other discrete log boundaries.
This operates on number of samples, hence the actual distance which is masked depends on the sampling interval (ie. count) or on distance measures. Distance measures are TVD (true vertical depth) or MD (measured depth).
- Parameters
inputlogs (
List[str]) – List of input logs, must be of discrete type.targetlogs (
List[str]) – List of logs where mask is applied.nsamples (
Union[int,Dict[str,float],None]) – Number of samples around boundaries to filter, per side, i.e. value 2 means 2 above and 2 below, in total 4 samples. As alternative specify nsamples indirectly with a relative distance, as a dictionary with one record, as {“tvd”: 0.5} or {“md”: 0.7}.strict (
Optional[bool]) – If True, will raise Exception of any of the input or target log names are missing.
- Return type
bool- Returns
- True if any operation has been done. False in case nothing has been done,
e.g. no targetlogs for this particular well and
strictis False.
- Raises
ValueError – Various messages when wrong or inconsistent input.
Example
>>> mywell1 = Well(well_dir + '/OP_1.w')
>>> mywell2 = Well(well_dir + '/OP_2.w')
>>> did_succeed = mywell1.mask_shoulderbeds(["Zonelog", "Facies"], ["Perm"])
>>> did_succeed = mywell2.mask_shoulderbeds(
...     ["Zonelog"],
...     ["Perm"],
...     nsamples={"tvd": 0.8}
... )
-
may_overlap(other)¶ Consider if well overlap in X Y coordinates with other well, True/False.
-
property
mdlogname¶ Returns name of MD log, if any (None if missing).
- Type
str
-
property
metadata¶ Return metadata object instance of type MetaDataRegularSurface.
-
property
name¶ Returns or set (rename) a well name.
-
property
ncol¶ Returns the Pandas dataframe object number of columns.
- Type
int
-
property
nlogs¶ Returns the Pandas dataframe object number of columns.
- Type
int
-
property
nrow¶ Returns the Pandas dataframe object number of rows.
- Type
int
-
rename_log(lname, newname)¶ Rename a log, e.g. Poro to PORO.
-
report_zonation_holes(threshold=5)¶ Reports if well has holes in zonation, less or equal to N samples.
Zonation may have holes due to various reasons, and usually a few undef samples indicates that something is wrong. This method reports well and start interval of the “holes”
The well shall have zonelog from import (via zonelogname attribute) and preferly a MD log (via mdlogname attribute); however if the latter is not present, a report withou MD values will be present.
- Parameters
threshold (int) – Number of samples (max.) that defines a hole, e.g. 5 means that undef samples in the range [1, 5] (including 5) is applied
- Returns
A Pandas dataframe as a report. None if no list is made.
- Raises
RuntimeError if zonelog is not present –
-
rescale(delta=0.15, tvdrange=None)¶ Rescale (refine or coarse) by sampling a delta along the trajectory, in MD.
- Parameters
delta (float) – Step length
tvdrange (tuple of floats) – Resampling can be limited to TVD interval
Changed in version 2.2: Added tvdrange
-
property
rkb¶ Returns RKB height for the well (read only).
-
property
safewellname¶ Get well name on syntax safe form; ‘/’ and spaces replaced with ‘_’.
-
set_logrecord(lname, newdict)¶ Sets the record (dict) of a given discrete log.
-
set_logtype(lname, ltype)¶ Sets the type of a give log (e.g. DISC or CONT).
-
set_wlogs(wlogs)¶ Set a compound dictionary with well log metadata.
This operation is somewhat risky as it may lead to inconsistency, so use with care! Typically, one will use
get_wlogs()first and then modify some attributes.- Parameters
wlogs (
OrderedDict) – Input data dictionary- Raises
ValueError – Invalid log type found in input:
ValueError – Invalid log record found in input:
ValueError – Invalid input key found:
ValueError – Invalid log record found in input:
-
property
shortwellname¶ Well name on a short form where blockname/spaces removed (read only).
This should cope with both North Sea style and Haltenbanken style.
E.g.: ‘31/2-G-5 AH’ -> ‘G-5AH’, ‘6472_11-F-23_AH_T2’ -> ‘F-23AHT2’
- Type
str
-
to_file(wfile, fformat='rms_ascii')¶ Export well to file or memory stream.
- Parameters
wfile (
Union[str,Path,BytesIO]) – File name or stream.fformat (
Optional[str]) – File format (‘rms_ascii’/’rmswell’, ‘hdf/hdf5/h5’).
Example:
>>> xwell = Well(well_dir + '/OP_1.w')
>>> xwell.dataframe['Poro'] += 0.1
>>> filename = xwell.to_file(outdir + "/somefile_copy.rmswell")
-
to_hdf(wfile, compression='lzf')¶ Export well to HDF based file.
Warning
This implementation is currently experimental and only recommended for testing.
- Parameters
wfile (
Union[str,Path]) – HDF File name to write to export to.compression (Optional[str, None]) –
- Return type
Path- Returns
A Path instance to actual file applied.
New in version 2.14.
-
to_roxar(*args, **kwargs)[source]¶ Set (export) a single blocked well item inside roxar project.
Note this method works only when inside RMS, or when RMS license is activated.
Note
When project is file path (direct access, outside RMS) then
to_roxar()will implicitly do a project save. Otherwise, the project will not be saved until the user do an explicit project save action.- Parameters
project (str or object) – Magic object ‘project’ or file path to project
gname (str) – Name of GridModel icon in RMS
bwname (str) – Name of Blocked Well icon in RMS, usually ‘BW’
wname (str) – Name of well, as shown in RMS.
lognames (list or "all") – List of lognames to include, or use ‘all’ for all current blocked logs for this well (except index logs). Default is “all”.
realisation (int) – Realisation index (0 is default)
ijk (bool) – If True, then also write special index logs if they exist, such as I_INDEX, J_INDEX, K_INDEX, etc. Default is False
-
property
truewellname¶ Returns well name on the assummed form aka ‘31/2-E-4 AH2’.
-
truncate_parallel_path(other, xtol=None, ytol=None, ztol=None, itol=None, atol=None)¶ Truncate the part of the well trajectory that is ~parallel with other.
- Parameters
other (Well) – Other well to compare with
xtol (float) – Tolerance in X (East) coord for measuring unit
ytol (float) – Tolerance in Y (North) coord for measuring unit
ztol (float) – Tolerance in Z (TVD) coord for measuring unit
itol (float) – Tolerance in inclination (degrees)
atol (float) – Tolerance in azimuth (degrees)
-
property
wellname¶ Returns well name, read only.
- Type
str
-
property
wname¶ Returns or set (rename) a well name.
-
property
xpos¶ Returns well header X position (read only).
-
property
xwellname¶ See safewellname.
-
property
ypos¶ Returns well header Y position (read only).
- Return type
float
-
property
zonelogname¶ Returns or sets name of zone log, return None if missing.
- Type
str
-
Blocked wells (multiple)
Functions
-
xtgeo.blockedwells_from_roxar(project, gname, bwname, lognames=None, ijk=True)[source]¶ This makes an instance of a BlockedWells directly from Roxar RMS.
For arguments, see
BlockedWells.from_roxar().Note the difference between classes BlockedWell and BlockedWells.
Example:
# inside RMS:
import xtgeo
mylogs = ['ZONELOG', 'GR', 'Facies']
mybws = xtgeo.blockedwells_from_roxar(project, 'Simgrid', 'BW',
                                    lognames=mylogs)
Classes
-
class
xtgeo.BlockedWells(wells=None)[source]¶ Bases:
xtgeo.well.wells.WellsClass for a collection of BlockedWell objects, for operations that involves a number of wells.
See also the
xtgeo.well.BlockedWellclass.Public Data Attributes:
Inherited from
WellsnamesReturns a list of well names (read only).
wellsReturns or sets a list of XTGeo Well objects, None if empty.
Public Methods:
copy()Copy a BlockedWells instance to a new unique instance.
get_blocked_well(name)Get a BlockedWell() instance by name, or None
from_files(filelist[, fformat, mdlogname, …])Import blocked wells from a list of files (filelist).
from_roxar(*args, **kwargs)Import (retrieve) blocked wells from roxar project.
Inherited from
Wellsdescribe([flush])Describe an instance by printing to stdout
copy()Copy a Wells instance to a new unique instance (a deep copy).
get_well(name)Get a Well() instance by name, or None
from_files(filelist[, fformat, mdlogname, …])Deprecated see
wells_from_files()from_roxar(*args, **kwargs)Import (retrieve) all wells (or based on a filter) from roxar project.
get_dataframe([filled, fill_value1, fill_value2])Get a big dataframe for all wells or blocked wells in instance, with well name as first column
quickplot([filename, title])Fast plot of wells using matplotlib.
limit_tvd(tvdmin, tvdmax)Limit TVD to be in range tvdmin, tvdmax for all wells
downsample([interval, keeplast])Downsample by sampling every N’th element (coarsen only), all wells.
wellintersections([wfilter, showprogress])Get intersections between wells, return as dataframe table.
- Parameters
wells (List[xtgeo.well.well1.Well]) –
-
__init__(wells=None)¶ Initialize self. See help(type(self)) for accurate signature.
- Parameters
wells (List[xtgeo.well.well1.Well]) –
-
describe(flush=True)¶ Describe an instance by printing to stdout
-
downsample(interval=4, keeplast=True)¶ Downsample by sampling every N’th element (coarsen only), all wells.
-
from_files(filelist, fformat='rms_ascii', mdlogname=None, zonelogname=None, strict=True, append=True)[source]¶ Import blocked wells from a list of files (filelist).
- Parameters
filelist (list of str) – List with file names
fformat (str) – File format, rms_ascii (rms well) is currently supported and default format.
mdlogname (str) – Name of measured depth log, if any
zonelogname (str) – Name of zonation log, if any
strict (bool) – If True, then import will fail if zonelogname or mdlogname are asked for but not present in wells.
append (bool) – If True, new wells will be added to existing wells.
Example
Here the from_file method is used to initiate the object directly:
mywells = BlockedWells(['31_2-6.w', '31_2-7.w', '31_2-8.w'])
Deprecated since version 2.16: This will be removed in 4.0. Use xtgeo.blockedwells_from_files() instead
-
from_roxar(*args, **kwargs)[source]¶ Import (retrieve) blocked wells from roxar project.
Note this method works only when inside RMS, or when RMS license is activated.
All the wells present in the bwname icon will be imported.
- Parameters
project (str) – Magic string ‘project’ or file path to project
gname (str) – Name of GridModel icon in RMS
bwname (str) – Name of Blocked Well icon in RMS, usually ‘BW’
lognames (list) – List of lognames to include, or use ‘all’ for all current blocked logs for this well.
ijk (bool) – If True, then logs with grid IJK as I_INDEX, etc
realisation (int) – Realisation index (0 is default)
Deprecated since version 2.16: This will be removed in 4.0. Use xtgeo.blockedwells_from_roxar() instead
-
get_dataframe(filled=False, fill_value1=- 999, fill_value2=- 9999)¶ Get a big dataframe for all wells or blocked wells in instance, with well name as first column
- Parameters
filled (bool) – If True, then NaN’s are replaces with values
fill_value1 (int) – Only applied if filled=True, for logs that have missing values
fill_value2 (int) – Only applied if filled=True, when logs are missing completely for that well.
-
get_well(name)¶ Get a Well() instance by name, or None
-
limit_tvd(tvdmin, tvdmax)¶ Limit TVD to be in range tvdmin, tvdmax for all wells
-
property
names¶ Returns a list of well names (read only).
Example:
namelist = wells.names
for prop in namelist:
    print ('Well name is {}'.format(name))
-
quickplot(filename=None, title='QuickPlot')¶ Fast plot of wells using matplotlib.
- Parameters
filename (str) – Name of plot file; None will plot to screen.
title (str) – Title of plot
-
wellintersections(wfilter=None, showprogress=False)¶ Get intersections between wells, return as dataframe table.
Notes on wfilter: A wfilter is settings to improve result. In particular to remove parts of trajectories that are parallel.
- wfilter = {‘parallel’: {‘xtol’: 4.0, ‘ytol’: 4.0, ‘ztol’:2.0,
‘itol’:10, ‘atol’:2}}
Here xtol is tolerance in X coordinate; further Y tolerance, Z tolerance, (I)nclination tolerance, and (A)zimuth tolerance.
- Parameters
tvdrange (tuple of floats) – Search interval. One is often just interested in the reservoir section.
wfilter (dict) – A dictionrary for filter options, in order to improve result. See example above.
showprogress (bool) – Will show progress to screen if enabled.
- Returns
- A Pandas dataframe object, with columns WELL, CWELL and UTMX UTMY
TVD coordinates for CWELL where CWELL crosses WELL, and also MDEPTH for the WELL.
-
property
wells¶ Returns or sets a list of XTGeo Well objects, None if empty.
Cubes (e.g. seismic)
Cube
Functions
-
xtgeo.cube_from_file(mfile, fformat='guess')[source]¶ This makes an instance of a Cube directly from file import.
- Parameters
mfile (str) – Name of file
fformat (str) – See
Cube.from_file()
Example:
>>> import xtgeo
>>> mycube = xtgeo.cube_from_file(cube_dir + "/ib_test_cube2.segy")
Classes
-
class
xtgeo.Cube(ncol, nrow, nlay, xinc, yinc, zinc, xori=0.0, yori=0.0, zori=0.0, yflip=1, values=0.0, rotation=0.0, zflip=1, ilines=None, xlines=None, traceidcodes=None, segyfile=None, filesrc=None)[source]¶ Bases:
objectClass for a (seismic) cube in the XTGeo framework.
The values are stored as a 3D numpy array (4 bytes; float32 is default), with internal C ordering (nlay fastest).
See
xtgeo.cube_from_file()for importing cubes from e.g. segy files.See also Cube section in documentation: docs/datamodel.rst
Examples:
>>> import xtgeo
>>> # a user defined cube:
>>> mycube = xtgeo.Cube(
...     xori=100.0,
...     yori=200.0,
...     zori=150.0,
...     ncol=40,
...     nrow=30,
...     nlay=10,
...     rotation=30,
...     values=0
... )
- Parameters
xori – Origin in Easting coordinate
yori – Origin in Northing coordinate
zori – Origin in Depth coordinate, where depth is positive down
ncol – Number of columns
nrow – Number of columns
nlay – Number of layers, starting from top
rotation – Cube rotation, X axis is applied and “school-wise” rotation, anti-clock in degrees
values – Numpy array with shape (ncol, nrow, nlay), C order, np.float32
ilines – 1D numpy array with ncol elements, aka INLINES array, defaults to arange
xlines – 1D numpy array with nrow elements, aka XLINES array, defaults to arange
segyfile – Name of source segyfile if any
filesrc – String: Source file if any
yflip – Normally 1; if -1 Y axis is flipped –> from left-handed (1) to right handed (-1). Right handed cubes are common.
Initiate a Cube instance.
Public Data Attributes:
metadataReturn metadata object instance of type MetaDataRegularSurface.
ncolThe NCOL (NX or I dir) number (read-only).
nrowThe NROW (NY or J dir) number (read-only).
nlayThe NLAY (or NZ or K dir) number (read-only).
dimensionsThe cube dimensions as a tuple of 3 integers (read only).
xoriThe XORI (origin corner) coordinate.
yoriThe YORI (origin corner) coordinate.
zoriThe ZORI (origin corner) coordinate.
xincThe XINC (increment X) as property.
yincThe YINC (increment Y).
zincThe ZINC (increment Z).
rotationThe rotation, anticlock from X axis in degrees.
ilinesThe inlines numbering vector.
xlinesThe xlines numbering vector.
zslicesReturn the time/depth slices as an int array (read only).
traceidcodesThe trace identifaction codes array (ncol, nrow).
yflipThe YFLIP indicator, 1 is normal, -1 means Y flipped.
zflipThe ZFLIP indicator, 1 is normal, -1 means Z flipped.
segyfileThe input segy file name (str), if any (or None) (read-only).
filesrcThe input file name (str), if any (or None) (read-only).
valuesThe values, as a 3D numpy (ncol, nrow, nlay), 4 byte float.
Public Methods:
generate_hash([hashmethod])Return a unique hash ID for current instance.
describe([flush])Describe an instance by printing to stdout or return.
copy()Deep copy of a Cube() object to another instance.
swapaxes()Swap the axes inline vs xline, keep origin.
resample(incube[, sampling, outside_value])Resample a Cube object into this instance.
do_thinning(icol, jrow, klay)Thinning the cube by removing every N column, row and/or layer.
do_cropping(icols, jrows, klays[, mode])Cropping the cube by removing rows, columns, layers.
values_dead_traces(newvalue)Set values for traces flagged as dead.
get_xy_value_from_ij(iloc, jloc[, ixline, …])Returns x, y coordinate from a single i j location.
get_randomline(fencespec[, zmin, zmax, …])Get a randomline from a fence spesification.
from_file(sfile[, fformat, engine])Deprecated, see
cube_from_file().to_file(sfile[, fformat, pristine, engine])Export cube data to file.
from_roxar(project, name[, folder])Import (transfer) a cube from a Roxar seismic object to XTGeo.
to_roxar(project, name[, folder, domain, …])Export (transfer) a cube from a XTGeo cube object to Roxar data.
scan_segy_traces(sfile[, outfile])Scan a SEGY file traces and print limits info to STDOUT or file.
scan_segy_header(sfile[, outfile])Scan a SEGY file header and print info to screen or file.
-
__init__(ncol, nrow, nlay, xinc, yinc, zinc, xori=0.0, yori=0.0, zori=0.0, yflip=1, values=0.0, rotation=0.0, zflip=1, ilines=None, xlines=None, traceidcodes=None, segyfile=None, filesrc=None)[source]¶ Initiate a Cube instance.
-
copy()[source]¶ Deep copy of a Cube() object to another instance.
>>> mycube = xtgeo.cube_from_file(cube_dir + "/ib_test_cube2.segy")
>>> mycube2 = mycube.copy()
-
describe(flush=True)[source]¶ Describe an instance by printing to stdout or return.
- Parameters
flush (bool) – If True, description is printed to stdout.
-
property
dimensions¶ The cube dimensions as a tuple of 3 integers (read only).
- Type
3-tuple
-
do_cropping(icols, jrows, klays, mode='edges')[source]¶ Cropping the cube by removing rows, columns, layers.
Note that input boundary checking is currently lacking, and this is a currently a user responsibility!
The ‘mode’ is used to determine to different ‘approaches’ on cropping. Examples for icols and mode ‘edges’: Here the tuple (N, M) will cut N first rows and M last rows.
However, if mode is ‘inclusive’ then, it defines the range of rows to be included, and the numbering now shall be the INLINE, XLINE and DEPTH/TIME mode.
- Parameters
icols (int tuple) – Cropping front, end of rows, or inclusive range
jrows (int tuple) – Cropping front, end of columns, or inclusive range
klays (int tuple) – Cropping top, base layers, or inclusive range.
mode (str) – ‘Default is ‘edges’; alternative is ‘inclusive’
Example
Crop 10 columns from front, 2 from back, then 20 rows in front, 40 in back, then no cropping of layers:
>>> import xtgeo
>>> mycube1 = xtgeo.cube_from_file(cube_dir + "/ib_test_cube2.segy")
>>> mycube2 = mycube1.copy()
>>> mycube1.do_cropping((10, 2), (20, 40), (0, 0))
>>> mycube1.to_file(outdir + '/mysegy_smaller.segy')
In stead, do cropping as ‘inclusive’ where inlines, xlines, slices arrays are known:
>>> mycube2.do_cropping((11, 32), (112, 114), (150, 200))
-
do_thinning(icol, jrow, klay)[source]¶ Thinning the cube by removing every N column, row and/or layer.
- Parameters
icol (int) – Thinning factor for columns (usually inlines)
jrow (int) – Thinning factor for rows (usually xlines)
klay (int) – Thinning factor for layers
- Raises
ValueError – If icol, jrow or klay are out of reasonable range
Example
>>> mycube1 = Cube(cube_dir + "/ib_test_cube2.segy")
>>> mycube1.do_thinning(2, 2, 1)  # keep every second column, row
>>> mycube1.to_file(outdir + '/mysegy_smaller.segy')
-
property
filesrc¶ The input file name (str), if any (or None) (read-only).
-
from_file(sfile, fformat='guess', engine=None)[source]¶ Deprecated, see
cube_from_file().Deprecated since version 2.16: This will be removed in 4.0. Use xtgeo.cube_from_file() instead
-
from_roxar(project, name, folder=None)[source]¶ Import (transfer) a cube from a Roxar seismic object to XTGeo.
- Parameters
project (str) – Inside RMS use the magic ‘project’, else use path to RMS project
name (str) – Name of cube within RMS project.
folder (str) – Folder name in in RMS if present; use ‘/’ to seperate subfolders
- Raises
To be described... –
Example:
zz = Cube()
zz.from_roxar(project, 'truth_reek_seismic_depth_2000', folder="alt/depth")
-
generate_hash(hashmethod='md5')[source]¶ Return a unique hash ID for current instance.
See
generic_hash()for documentation.New in version 2.14.
-
get_randomline(fencespec, zmin=None, zmax=None, zincrement=None, hincrement=None, atleast=5, nextend=2, sampling='nearest')[source]¶ Get a randomline from a fence spesification.
This randomline will be a 2D numpy with depth/time on the vertical axis, and length along as horizontal axis. Undefined values will have the np.nan value.
The input fencespec is either a 2D numpy where each row is X, Y, Z, HLEN, where X, Y are UTM coordinates, Z is depth/time, and HLEN is a length along the fence, or a Polygons instance.
If input fencspec is a numpy 2D, it is important that the HLEN array has a constant increment and ideally a sampling that is less than the Cube resolution. If a Polygons() instance, this is automated!
- Parameters
fencespec (
ndarrayorPolygons) – 2D numpy with X, Y, Z, HLEN as rows or a xtgeo Polygons() object.zmin (float) – Minimum Z (default is Cube Z minima/origin)
zmax (float) – Maximum Z (default is Cube Z maximum)
zincrement (float) – Sampling vertically, default is Cube ZINC/2
hincrement (float or bool) – Resampling horizontally. This applies only if the fencespec is a Polygons() instance. If None (default), the distance will be deduced automatically.
atleast (int) – Minimum number of horizontal samples (only if fencespec is a Polygons instance)
nextend (int) – Extend with nextend * hincrement in both ends (only if fencespec is a Polygons instance)
sampling (str) – Algorithm, ‘nearest’ or ‘trilinear’ (first is faster, second is more precise for continuous fields)
- Returns
(hmin, hmax, vmin, vmax, ndarray2d)
- Return type
A tuple
- Raises
ValueError – Input fence is not according to spec.
Changed in version 2.1: support for Polygons() as fencespec, and keywords hincrement, atleast and sampling
See also
- Class
Polygons The method
get_fence()which can be used to pregenerate fencespec
-
get_xy_value_from_ij(iloc, jloc, ixline=False, zerobased=False)[source]¶ Returns x, y coordinate from a single i j location.
- Parameters
iloc (int) – I (col) location (base is 1)
jloc (int) – J (row) location (base is 1)
ixline (bool) – If True, then input locations are inline and xline position
zerobased (bool) – If True, first index is 0, else it is 1. This does not apply when ixline is set to True.
- Returns
The X, Y coordinate pair.
-
property
ilines¶ The inlines numbering vector.
-
property
metadata¶ Return metadata object instance of type MetaDataRegularSurface.
-
property
ncol¶ The NCOL (NX or I dir) number (read-only).
-
property
nlay¶ The NLAY (or NZ or K dir) number (read-only).
-
property
nrow¶ The NROW (NY or J dir) number (read-only).
-
resample(incube, sampling='nearest', outside_value=None)[source]¶ Resample a Cube object into this instance.
- Parameters
incube (Cube) – A XTGeo Cube instance
sampling (str) – Sampling algorithm: ‘nearest’ for nearest node of ‘trilinear’ for trilinear interpoltion (more correct but slower)
outside_value (None or float) – use this value
- Raises
ValueError – If cubes do not overlap
Example
>>> import xtgeo
>>> mycube1 = xtgeo.cube_from_file(cube_dir + "/ib_test_cube2.segy")
>>> mycube2 = xtgeo.Cube(
...     xori=777574,
...     yori=6736507,
...     zori=1000,
...     xinc=10,
...     yinc=10,
...     zinc=4,
...     ncol=100,
...     nrow=100,
...     nlay=100,
...     yflip=mycube1.yflip,
...     rotation=mycube1.rotation
... )
>>> mycube2.resample(mycube1)
-
property
rotation¶ The rotation, anticlock from X axis in degrees.
-
static
scan_segy_header(sfile, outfile=None)[source]¶ Scan a SEGY file header and print info to screen or file.
- Parameters
sfile (str) – Name of SEGY file
outfile (str) – File where store header info, if empty or None output goes to screen (STDOUT).
-
static
scan_segy_traces(sfile, outfile=None)[source]¶ Scan a SEGY file traces and print limits info to STDOUT or file.
- Parameters
sfile (str) – Name of SEGY file
outfile – File where store scanned trace info, if empty or None output goes to STDOUT.
-
property
segyfile¶ The input segy file name (str), if any (or None) (read-only).
-
to_file(sfile, fformat='segy', pristine=False, engine='xtgeo')[source]¶ Export cube data to file.
- Parameters
sfile (str) – Filename
fformat (str, optional) – file format ‘segy’ (default) or ‘rms_regular’
pristine (bool) – If True, make SEGY from scratch.
engine (str) – Which “engine” to use.
- Example::
>>> import xtgeo
>>> zz = xtgeo.cube_from_file(cube_dir + "/ib_test_cube2.segy")
>>> zz.to_file(outdir + '/some.rmsreg')
-
to_roxar(project, name, folder=None, domain='time', compression=('wavelet', 5))[source]¶ Export (transfer) a cube from a XTGeo cube object to Roxar data.
Note
When project is file path (direct access, outside RMS) then
to_roxar()will implicitly do a project save. Otherwise, the project will not be saved until the user do an explicit project save action.- Parameters
project (str or roxar._project) – Inside RMS use the magic ‘project’, else use path to RMS project, or a project reference
name (str) – Name of cube (seismic data) within RMS project.
folder (str) – Cubes may be stored under a folder in the tree, use ‘/’ to seperate subfolders.
domain (str) – ‘time’ (default) or ‘depth’
compression (tuple) – description to come…
- Raises
To be described... –
Example:
zz = xtgeo.cube.Cube('myfile.segy')
zz.to_roxar(project, 'reek_cube')

# alternative
zz = xtgeo.cube_from_file('myfile.segy')
zz.to_roxar(project, 'reek_cube')
-
property
traceidcodes¶ The trace identifaction codes array (ncol, nrow).
-
property
values¶ The values, as a 3D numpy (ncol, nrow, nlay), 4 byte float.
-
values_dead_traces(newvalue)[source]¶ Set values for traces flagged as dead.
Dead traces have traceidcodes 2 and corresponding values in the cube will here receive a constant value to mimic “undefined”.
- Parameters
newvalue (float) – Set cube values to newvalues where traceid is 2.
- Returns
- The estimated simple ‘average’ of old value will
be returned as (max + min)/2. If no dead traces, return None.
- Return type
oldvalue (float)
-
property
xinc¶ The XINC (increment X) as property.
-
property
xlines¶ The xlines numbering vector.
-
property
xori¶ The XORI (origin corner) coordinate.
-
property
yflip¶ The YFLIP indicator, 1 is normal, -1 means Y flipped.
YFLIP = 1 means a LEFT HANDED coordinate system with Z axis positive down, while inline (col) follow East (X) and xline (rows) follows North (Y), when rotation is zero.
-
property
yinc¶ The YINC (increment Y).
-
property
yori¶ The YORI (origin corner) coordinate.
-
property
zflip¶ The ZFLIP indicator, 1 is normal, -1 means Z flipped.
ZFLIP = 1 and YFLIP = 1 means a LEFT HANDED coordinate system with Z axis positive down, while inline (col) follow East (X) and xline (rows) follows North (Y), when rotation is zero.
-
property
zinc¶ The ZINC (increment Z).
-
property
zori¶ The ZORI (origin corner) coordinate.
-
property
zslices¶ Return the time/depth slices as an int array (read only).
3D grids and properties
Grid
Functions
-
xtgeo.grid_from_file(gfile, fformat=None, **kwargs)[source]¶ Read a grid (cornerpoint) from filelike and an returns a Grid() instance.
- Parameters
gfile (str or Path) – File name to be imported. If fformat=”eclipse_run” then a fileroot name shall be input here, see example below.
fformat (str) – File format egrid/roff/grdecl/bgrdecl/eclipserun/xtgcpgeom (None is default and means “guess”)
initprops (str list) – Optional, and only applicable for file format “eclipserun”. Provide a list the names of the properties here. A special value “all” can be get all properties found in the INIT file
restartprops (str list) – Optional, see initprops
restartdates (int list) – Optional, required if restartprops
ijkrange (list-like) – Optional, only applicable for hdf files, see
Grid.from_hdf().zerobased (bool) – Optional, only applicable for hdf files, see
Grid.from_hdf().mmap (bool) – Optional, only applicable for xtgf files, see
Grid.from_xtgf().
Example:
>>> import xtgeo
>>> mygrid = xtgeo.grid_from_file(reek_dir + "/REEK.EGRID")
Example using “eclipserun”:
>>> mycase = "REEK"  # meaning REEK.EGRID, REEK.INIT, REEK.UNRST
>>> xg = xtgeo.grid_from_file(
...     reek_dir + "/" + mycase,
...     fformat="eclipserun",
...     initprops="all",
... )
Grid ... filesrc='.../REEK.EGRID'
- Raises
OSError – if file is not found etc
-
xtgeo.grid_from_roxar(project, gname, realisation=0, dimensions_only=False, info=False)[source]¶ Read a 3D grid inside a RMS project and return a Grid() instance.
- Parameters
project (str or special) – The RMS project or the project variable from inside RMS.
gname (str) – Name of Grid Model in RMS.
realisation (int) – Realisation number.
dimensions_only (bool) – If True, only the ncol, nrow, nlay will read. The actual grid geometry will remain empty (None). This will be much faster of only grid size info is needed, e.g. for initalising a grid property.
info (bool) – If true, only grid info
Example:
# inside RMS
import xtgeo
mygrid = xtgeo.grid_from_roxar(project, "REEK_SIM")
Classes
-
class
xtgeo.Grid(coordsv, zcornsv, actnumsv, dualporo=False, dualperm=False, subgrids=None, units=None, filesrc=None, props=None, name=None, roxgrid=None, roxindexer=None)[source]¶ Bases:
xtgeo.grid3d._grid3d._Grid3DClass for a 3D grid corner point geometry in XTGeo.
I.e. the geometric grid cells and the active cell indicator.
The grid geometry class instances are normally created when importing a grid from file, as it is normally too complex to create from scratch.
- Parameters
coordsv (
ndarray) – numpy array of dtype float64 and dimensions (nx + 1, ny + 1, 6) Giving the x,y,z values of the upper and lower corners in the grid.zcornsv (
ndarray) – numpy array of dtype float32 and dimensions (nx + 1, ny + 1, nz + 1, 4) giving the sw, se, nw, ne corners along the i,jth corner line for the kth layer.actnumsv (
ndarray) – numpy array of dtype int32 and dimensions (nx, ny, nz) giving the activity number for each cell. 0 means inactive, 1 means active. For dualporo=True/dualperm=True grids, value can also be 2 or 3 meaning rock volume only and pore volume only respectively.dualporo (bool) – True if dual porosity grid.
dualperm (bool) – True if dual permeability grid.
subgrids (
OrderedDict) – dictionary giving names to subset of layers. Has name as key and list of layer indices as values. Defaults to no names given.units (
Optional[Units]) – The length units the coordinates are in, (either Units.CM, Units.METRES, Units.FEET for cm, metres and feet respectively). Default (None) is unitless.filesrc (
Union[str,Path,None]) – Optional filename of grid.props (
Optional[GridProperties]) – GridProperties instance containing the properties of the grid, defaults to empty instance.name (
Optional[str]) – Optional name of the grid.roxgrid – Roxar Grid the Grid originates from if any, defaults to no such grid.
roxindexer – Roxar grid indexer for the roxgrid. Defaults to no such indexer.
See also
The
GridPropertyand theGridPropertiesclasses.Public Data Attributes:
metadataReturn or set metadata instance of type MetaDataCPGeometry.
filesrcSource for grid (filepath or name in RMS).
nameName attribute of grid.
ncolNumber of columns (read only).
nrowNumber of rows (read only).
nlayNumber of layers (read only).
dimensionsThe grid dimensions as a tuple of 3 integers (read only).
vectordimensionsThe storage grid array dimensions tuple of 3 integers (read only).
ijk_handednessIJK handedness for grids, “right” or “left”.
subgridsA dict with subgrid name and an array as value.
nactiveReturns the number of active cells (read only).
actnum_arrayReturns the 3D ndarray which for active cells.
actnum_indicesnp.ndrarray: Indices (1D array) for active cells (read only).
ntotalReturns the total number of cells (read only).
dualporoBoolean flag for dual porosity scheme (read only).
dualpermBoolean flag for dual porosity scheme (read only).
gridpropsReturn or set a XTGeo GridProperties objects attached to the Grid.
propsReturn or set a list of XTGeo GridProperty objects.
propnamesReturns a list of property names that are hooked to a grid.
roxgridGet the Roxar native proj.grid_models[gname].get_grid() object.
roxindexerThe Roxar native proj.grid_models[gname].get_grid().grid_indexer object.
Inherited from
_Grid3DncolReturns the NCOL (NX or Ncolumns) number of cells.
nrowReturns the NROW (NY or Nrows) number of cells.
nlayReturns the NLAY (NZ or Nlayers) number of cells.
Public Methods:
generate_hash([hashmethod])Return a unique hash ID for current instance.
create_box([dimension, origin, oricenter, …])Create a rectangular ‘shoebox’ grid from spec.
to_file(gfile[, fformat])Export grid geometry to file, various vendor formats.
to_hdf(gfile[, compression, chunks, subformat])Export grid geometry to HDF5 storage format (experimental!).
to_xtgf(gfile[, subformat])Export grid geometry to xtgeo native binary file format (experimental!).
to_roxar(project, gname[, realisation, …])Export (upload) a grid from XTGeo to RMS via Roxar API.
from_file(gfile[, fformat])Import grid geometry from file, and makes an instance of this class.
from_hdf(gfile[, ijkrange, zerobased])Import grid geometry from HDF5 file (experimental!).
from_xtgf(gfile[, mmap])Import grid geometry from native xtgeo file format (experimental!).
from_roxar(projectname, gname[, …])Import grid model geometry from RMS project, and makes an instance.
convert_units(units)Convert the units of the grid.
copy()Copy from one existing Grid instance to a new unique instance.
describe([details, flush])Describe an instance by printing to stdout.
get_dataframe([activeonly, ijk, xyz, …])Returns a Pandas dataframe for the grid and any attached grid properties.
dataframe(*args, **kwargs)Deprecated since version 2.16.
get_vtk_esg_geometry_data()Get grid geometry data suitable for use with VTK’s vtkExplicitStructuredGrid.
get_vtk_geometries()Get necessary arrays on correct layout for VTK ExplicitStructuredGrid usage.
append_prop(prop)Append a single property to the grid.
set_subgrids(sdict)Set the subgrid from a simplified ordered dictionary.
get_subgrids()Get the subgrids on a simplified ordered dictionary.
rename_subgrids(names)Rename the names in the subgrids with the new names.
estimate_design([nsub])Estimate design and simbox thickness of the grid or a subgrid.
estimate_flip()Estimate flip (handedness) of grid returns as 1 or -1.
subgrids_from_zoneprop(zoneprop)Estimate subgrid index from a zone property.
get_zoneprop_from_subgrids()Make a XTGeo GridProperty instance for a Zone property subgrid index.
get_actnum_indices([order, inverse])Returns the 1D ndarray which holds the indices for active cells.
get_dualactnum_indices([order, fracture])Returns the 1D ndarray which holds the indices for matrix/fracture cases.
get_gridproperties()Return the
GridPropertiesinstance attached to the grid.get_prop_by_name(name)Gets a property object by name lookup, return None if not present.
get_actnum([name, asmasked, mask, dual])Return an ACTNUM GridProperty object.
set_actnum(actnum)Modify the existing active cell index, ACTNUM.
get_dz([name, flip, asmasked, mask, metric])Return the dZ as GridProperty object.
get_dx([name, asmasked, metric])Return the dX as GridProperty object.
get_dy([name, asmasked, metric])Return the dY as GridProperty object.
get_dxdy([names, asmasked])Return the dX and dY as GridProperty object.
get_cell_volume([ijk, activeonly, …])Return the bulk volume for a given cell.
get_bulk_volume([name, asmasked, precision])Return the geometric cell volume for all cells as a GridProperty object.
get_ijk([names, asmasked, mask, zerobased])Returns 3 xtgeo.grid3d.GridProperty objects: I counter, J counter, K counter.
get_ijk_from_points(points[, activeonly, …])Returns a list/dataframe of cell indices based on a Points() instance.
get_xyz([names, asmasked, mask])Returns 3 xtgeo.grid3d.GridProperty objects for x, y, z coordinates.
get_xyz_cell_corners([ijk, activeonly, …])Return a 8 * 3 tuple x, y, z for each corner.
get_xyz_corners([names])Returns 8*3 (24) xtgeo.grid3d.GridProperty objects, x, y, z for each corner.
get_layer_slice(layer[, top, activeonly])Get numpy arrays for cell coordinates e.g.
get_geometrics([allcells, cellcenter, …])Get a list of grid geometrics such as origin, min, max, etc.
get_adjacent_cells(prop, val1, val2[, …])Get a discrete property which reports val1 properties vs neighbouring val2.
get_gridquality_properties()Return a GridProperties() instance with grid quality measures.
activate_all()Activate all cells in the grid, by manipulating ACTNUM.
inactivate_by_dz(threshold)Inactivate cells thinner than a given threshold.
inactivate_inside(poly[, layer_range, …])Inacativate grid inside a polygon.
inactivate_outside(poly[, layer_range, …])Inacativate grid outside a polygon.
collapse_inactive_cells()Collapse inactive layers where, for I J with other active cells.
crop(colcrop, rowcrop, laycrop[, props])Reduce the grid size by cropping.
reduce_to_one_layer()Reduce the grid to one single layer.
translate_coordinates([translate, flip])Translate (move) and/or flip grid coordinates in 3D.
reverse_row_axis([ijk_handedness])Reverse the row axis (J indices).
make_zconsistent([zsep])Make the 3D grid consistent in Z, by a minimal gap (zsep).
convert_to_hybrid([nhdiv, toplevel, …])Convert to hybrid grid, either globally or in a selected region.
refine_vertically(rfactor[, zoneprop])Refine vertically, proportionally.
report_zone_mismatch([well, zonelogname, …])Reports mismatch between wells and a zone.
get_randomline(fencespec, prop[, zmin, …])Get a sampled randomline from a fence spesification.
-
__init__(coordsv, zcornsv, actnumsv, dualporo=False, dualperm=False, subgrids=None, units=None, filesrc=None, props=None, name=None, roxgrid=None, roxindexer=None)[source]¶ Initialize self. See help(type(self)) for accurate signature.
- Parameters
coordsv (numpy.ndarray) –
zcornsv (numpy.ndarray) –
actnumsv (numpy.ndarray) –
dualporo (bool) –
dualperm (bool) –
subgrids (collections.OrderedDict) –
units (Optional[xtgeo.grid3d._ecl_grid.Units, None]) –
filesrc (Optional[Union[str, pathlib.Path]]) –
props (Optional[xtgeo.grid3d.grid_properties.GridProperties, None]) –
name (Optional[str, None]) –
-
property
actnum_array¶ Returns the 3D ndarray which for active cells.
Values are 1 for active, 0 for inactive, in C order (read only).
-
property
actnum_indices¶ np.ndrarray: Indices (1D array) for active cells (read only).
In dual poro/perm systems, this will be the active indices for the matrix cells and/or fracture cells (i.e. actnum >= 1).
- Type
obj
-
convert_to_hybrid(nhdiv=10, toplevel=1000.0, bottomlevel=1100.0, region=None, region_number=None)[source]¶ Convert to hybrid grid, either globally or in a selected region.
This function will convert the internal structure in the corner point grid, so that the cells between two levels
toplevelandbottomlevelbecome horizontal, which can be useful in flow simulators when e.g. liquid contact movements are dominating. See example on usage in the Troll field.Note that the resulting hybrid will have an increased number of layers. If the initial grid has N layers, and the number of horizontal layers is NHDIV, then the result grid will have N * 2 + NHDIV layers.

- Parameters
nhdiv (int) – Number of hybrid layers.
toplevel (float) – Top of hybrid grid.
bottomlevel (float) – Base of hybrid grid.
region (GridProperty, optional) – Region property (if needed).
region_number (int) – Which region to apply hybrid grid in if region.
Example
Create a hybridgrid from file, based on a GRDECL file (no region):
import xtgeo
grd = xtgeo.grid_from_file("simgrid.grdecl", fformat="grdecl")
grd.convert_to_hybrid(nhdiv=12, toplevel=2200, bottomlevel=2250)
# save in binary GRDECL fmt:
grd.to_file("simgrid_hybrid.bgrdecl", fformat="bgrdecl")
See also
Make a hybrid grid example.
-
convert_units(units)[source]¶ Convert the units of the grid. :param units: The unit to convert to.
- Raises
ValueError – When the grid is unitless (no initial unit information available).
-
copy()[source]¶ Copy from one existing Grid instance to a new unique instance.
Note that associated properties will also be copied.
Example:
>>> grd = create_box_grid((5,5,5))
>>> newgrd = grd.copy()
-
create_box(dimension=(10, 12, 6), origin=(10.0, 20.0, 1000.0), oricenter=False, increment=(100, 150, 5), rotation=30.0, flip=1)[source]¶ Create a rectangular ‘shoebox’ grid from spec.
- Parameters
dimension (tuple of int) – A tuple of (NCOL, NROW, NLAY)
origin (tuple of float) – Startpoint of grid (x, y, z)
oricenter (bool) – If False, startpoint is node, if True, use cell center
increment (tuple of float) – Grid increments (xinc, yinc, zinc)
rotation (float) – Roations in degrees, anticlock from X axis.
flip (int) – If +1, grid origin is lower left and left-handed; if -1, origin is upper left and right-handed (row flip).
- Returns
Instance is updated (previous instance content will be erased)
New in version 2.1.
Deprecated since version 2.16: This will be removed in 4.0. Use xtgeo.create_box_grid() instead
-
crop(colcrop, rowcrop, laycrop, props=None)[source]¶ Reduce the grid size by cropping.
The new grid will get new dimensions.
If props is “all” then all properties assosiated (linked) to then grid are also cropped, and the instances are updated.
- Parameters
colcrop (tuple) – A tuple on the form (i1, i2) where 1 represents start number, and 2 represent end. The range is inclusive for both ends, and the number start index is 1 based.
rowcrop (tuple) – A tuple on the form (j1, j2)
laycrop (tuple) – A tuple on the form (k1, k2)
props (list or str) – None is default, while properties can be listed. If “all”, then all GridProperty objects which are linked to the Grid instance are updated.
- Returns
The instance is updated (cropped)
Example:
>>> import xtgeo
>>> mygrid = xtgeo.grid_from_file(reek_dir + "/REEK.EGRID")
>>> mygrid.crop((3, 6), (4, 20), (1, 10))
>>> mygrid.to_file(outdir + "/gf_reduced.roff")
-
dataframe(*args, **kwargs)[source]¶ Deprecated since version 2.16: This will be removed in 4.0. Method dataframe is deprecated, use get_dataframe instead.
-
property
dimensions¶ The grid dimensions as a tuple of 3 integers (read only).
- Type
3-tuple
-
property
dualperm¶ Boolean flag for dual porosity scheme (read only).
-
property
dualporo¶ Boolean flag for dual porosity scheme (read only).
-
estimate_design(nsub=None)[source]¶ Estimate design and simbox thickness of the grid or a subgrid.
If the grid consists of several subgrids, and nsub is not specified, then a failure should be raised.
- Parameters
nsub (int or str) – Subgrid index to check, either as a number (starting with 1) or as subgrid name. If set to None, the whole grid will examined.
- Returns
- where key “design” gives one letter in(P, T, B, X, M)
P=proportional, T=topconform, B=baseconform, X=underdetermined, M=Mixed conform. Key “dzsimbox” is simbox thickness estimate per cell. None if nsub is given, but subgrids are missing, or nsub (name or number) is out of range.
- Return type
result (dict)
Example:
>>> import xtgeo
>>> grd = xtgeo.grid_from_file(emerald_dir + "/emerald_hetero_grid.roff")
>>> print(grd.subgrids)
OrderedDict([('subgrid_0', range(1, 17)), ('subgrid_1', range(17, 47))])
>>> res = grd.estimate_design(nsub="subgrid_0")
>>> print("Subgrid design is", res["design"])
Subgrid design is P
>>> print("Subgrid simbox thickness is", res["dzsimbox"])
Subgrid simbox thickness is 2.548...
-
estimate_flip()[source]¶ Estimate flip (handedness) of grid returns as 1 or -1.
The flip numbers are 1 for left-handed and -1 for right-handed.
See also
-
property
filesrc¶ Source for grid (filepath or name in RMS).
- Type
str
-
from_file(gfile, fformat=None, **kwargs)[source]¶ Import grid geometry from file, and makes an instance of this class.
If file extension is missing, then the extension will guess the fformat key, e.g. fformat egrid will be guessed if “.EGRID”. The “eclipserun” will try to input INIT and UNRST file in addition the grid in “one go”.
- Parameters
gfile (str or Path) – File name to be imported. If fformat=”eclipse_run” then a fileroot name shall be input here, see example below.
fformat (str) – File format egrid/roff/grdecl/bgrdecl/eclipserun/xtgcpgeom (None is default and means “guess”)
initprops (str list) – Optional, and only applicable for file format “eclipserun”. Provide a list the names of the properties here. A special value “all” can be get all properties found in the INIT file
restartprops (str list) – Optional, see initprops
restartdates (int list) – Optional, required if restartprops
ijkrange (list-like) – Optional, only applicable for hdf files, see
Grid.from_hdf().zerobased (bool) – Optional, only applicable for hdf files, see
Grid.from_hdf().mmap (bool) – Optional, only applicable for xtgf files, see
Grid.from_xtgf().
Example:
>>> xg = Grid()
>>> xg.from_file(reek_dir + "/REEK.EGRID", fformat="egrid")
Grid ... filesrc='.../REEK.EGRID'
Example using “eclipserun”:
>>> mycase = "REEK"  # meaning REEK.EGRID, REEK.INIT, REEK.UNRST
>>> xg = Grid()
>>> xg.from_file(
...     reek_dir + "/" + mycase,
...     fformat="eclipserun",
...     initprops="all",
... )
Grid ... filesrc='.../REEK.EGRID'
- Raises
OSError – if file is not found etc
Deprecated since version 2.16: This will be removed in 4.0. Use xtgeo.grid_from_file() instead
-
from_hdf(gfile, ijkrange=None, zerobased=False)[source]¶ Import grid geometry from HDF5 file (experimental!).
- Parameters
gfile (str) – Name of output file
ijkrange (list-like) – Partial read, e.g. (1, 20, 1, 30, 1, 3) as (i1, i2, j1, j2, k1, k2). Numbering scheme depends on zerobased, where default is eclipse-like i.e. first cell is 1. Numbering is inclusive for both ends. If ijkrange exceeds original range, an Exception is raised. Using existing boundaries can be defaulted by “min” and “max”, e.g. (1, 20, 5, 10, “min”, “max”)
zerobased (bool) – If True index in ijkrange is zero based.
- Raises
ValueError – The ijkrange spesification exceeds boundaries.
ValueError – The ijkrange list must have 6 elements
Example:
>>> xg = create_box_grid((20,20,5))
>>> filename = xg.to_hdf(outdir + "/myfile_grid.h5")
>>> xg.from_hdf(filename, ijkrange=(1, 10, 10, 15, 1, 4))
Deprecated since version 2.16: This will be removed in 4.0. Use xtgeo.grid_from_file() instead
-
from_roxar(projectname, gname, realisation=0, dimensions_only=False, info=False)[source]¶ Import grid model geometry from RMS project, and makes an instance.
- Parameters
projectname (str) – Name of RMS project
gname (str) – Name of grid model
realisation (int) – Realisation number.
dimensions_only (bool) – If True, only the ncol, nrow, nlay will read. The actual grid geometry will remain empty (None). This will be much faster of only grid size info is needed, e.g. for initalising a grid property.
info (bool) – If True, various info will printed to screen. This info will depend on version of ROXAPI, and is mainly a developer/debugger feature. Default is False.
Deprecated since version 2.16: This will be removed in 4.0. Use xtgeo.grid_from_roxar() instead
-
from_xtgf(gfile, mmap=False)[source]¶ Import grid geometry from native xtgeo file format (experimental!).
- Parameters
gfile (str) – Name of output file
mmap (bool) – If true, reading with memory mapping is active
Example:
>>> xg = create_box_grid((5,5,5))
>>> filename = xg.to_xtgf(outdir + "/myfile_grid.xtg")
>>> xg.from_xtgf(filename)
Deprecated since version 2.16: This will be removed in 4.0. Use xtgeo.grid_from_file() instead
-
generate_hash(hashmethod='md5')[source]¶ Return a unique hash ID for current instance.
See
generic_hash()for documentation.New in version 2.14.
-
get_actnum(name='ACTNUM', asmasked=False, mask=None, dual=False)[source]¶ Return an ACTNUM GridProperty object.
- Parameters
name (str) – name of property in the XTGeo GridProperty object.
asmasked (bool) – Actnum is returned with all cells shown as default. Use asmasked=True to make 0 entries masked.
mask (bool) – Deprecated, use asmasked instead!
dual (bool) – If True, and the grid is a dualporo/perm grid, an extended ACTNUM is applied (numbers 0..3)
Example:
>>> import xtgeo
>>> mygrid = xtgeo.create_box_grid((2,2,2))
>>> act = mygrid.get_actnum()
>>> print("{}% of cells are active".format(act.values.mean() * 100))
100.0% of cells are active
Changed in version 2.6: Added
dualkeyword
-
get_actnum_indices(order='C', inverse=False)[source]¶ Returns the 1D ndarray which holds the indices for active cells.
- Parameters
order (str) – “Either ‘C’ (default) or ‘F’ order).
inverse (bool) – Default is False, returns indices for inactive cells if True.
Changed in version 2.18: Added inverse option
-
get_adjacent_cells(prop, val1, val2, activeonly=True)[source]¶ Get a discrete property which reports val1 properties vs neighbouring val2.
The result will be a new gridproperty, which in general has value 0 but 1 if criteria is met, and 2 if criteria is met but cells are faulted.
- Parameters
prop (xtgeo.GridProperty) – A discrete grid property, e.g region
val1 (int) – Primary value to evaluate
val2 (int) – Neighbourung value
activeonly (bool) – If True, do not look at inactive cells
Raises: Nothing
-
get_bulk_volume(name='bulkvol', asmasked=True, precision=2)[source]¶ Return the geometric cell volume for all cells as a GridProperty object.
This method is currently experimental.
A bulk volume of a cornerpoint cell is actually a non-trivial and a non-unique entity. The volume is approximated by dividing the cell (hexahedron) into 6 tetrehedrons; there is however a large number of ways to do this division.
As default (precision=2) an average of two different ways to divide the cell into tetrahedrons is averaged.
- Parameters
name (str) – name of property, default to “bulkvol”
asmasked (bool) – are masked. Otherwise a numpy array will all bulk for all cells is returned
precision (int) – An number indication precision level, where a higher number means increased precision but also increased computing time. Currently 1, 2 (default), 4 are supported.
- Returns
XTGeo GridProperty object
New in version 2.13: (as experimental)
-
get_cell_volume(ijk=(1, 1, 1), activeonly=True, zerobased=False, precision=2)[source]¶ Return the bulk volume for a given cell.
This method is currently experimental.
A bulk volume of a cornerpoint cell is actually a non-trivial and a non-unique entity. The volume is approximated by dividing the cell (hexahedron) into 6 tetrehedrons; there is however a large number of ways to do this division.
As default (precision=2) an average of two different ways to divide the cell into tetrahedrons is averaged.
- Parameters
ijk (tuple) – A tuple of I J K (NB! cell counting starts from 1 unless zerobased is True).
activeonly (bool) – Skip undef cells if True; return None for inactive.
precision (int) – An even number indication precision level,where a higher number means increased precision but also increased computing time. Currently 1, 2, 4 are supported.
- Returns
Cell total bulk volume
Example:
>>> import xtgeo
>>> grid = xtgeo.grid_from_file(reek_dir + "/REEK.EGRID")
>>> print(grid.get_cell_volume(ijk=(10,13,2)))
107056...
New in version 2.13: (as experimental)
-
get_dataframe(activeonly=True, ijk=True, xyz=True, doubleformat=False)[source]¶ Returns a Pandas dataframe for the grid and any attached grid properties.
Note that this dataframe method is rather similar to GridProperties dataframe function, but have other defaults.
- Parameters
activeonly (bool) – If True (default), return only active cells.
ijk (bool) – If True (default), show cell indices, IX JY KZ columns
xyz (bool) – If True (default), show cell center coordinates.
doubleformat (bool) – If True, floats are 64 bit, otherwise 32 bit. Note that coordinates (if xyz=True) is always 64 bit floats.
- Returns
A Pandas dataframe object
Example:
>>> import xtgeo
>>> grd = xtgeo.grid_from_file(reek_dir + "/REEK.EGRID", fformat="egrid")
>>> names = ["SOIL", "SWAT", "PRESSURE"]
>>> dates = [19991201]
>>> xpr = xtgeo.gridproperties_from_file(
...     reek_dir + "/REEK.UNRST",
...     fformat="unrst",
...     names=names,
...     dates=dates,
...     grid=grd,
... )
>>> grd.gridprops = xpr  # attach properties to grid

>>> df = grd.get_dataframe()

>>> # save as CSV file
>>> df.to_csv(outdir + "/mygrid.csv")
-
get_dualactnum_indices(order='C', fracture=False)[source]¶ Returns the 1D ndarray which holds the indices for matrix/fracture cases.
- Parameters
order (str) – “Either ‘C’ (default) or ‘F’ order).
fracture (bool) – If True use Fracture properties.
-
get_dx(name='dX', asmasked=True, metric='horizontal')[source]¶ Return the dX as GridProperty object.
Returns the average length of x direction edges for each cell as a GridProperty. The length is by default horizontal vector length (see the metric parameter).
- Parameters
name (str) – names of properties
asmasked (bool) – are masked.
metric (str) – One of the following metrics: * “euclid”: sqrt(dx^2 + dy^2 + dz^2) * “horizontal”: sqrt(dx^2 + dy^2) * “east west vertical”: sqrt(dy^2 + dz^2) * “north south vertical”: sqrt(dx^2 + dz^2) * “x projection”: dx * “y projection”: dy * “z projection”: dz
- Returns
XTGeo GridProperty objects containing dx.
-
get_dxdy(names=('dX', 'dY'), asmasked=False)[source]¶ Return the dX and dY as GridProperty object.
The values lengths are projected to a constant Z.
- Parameters
name (tuple) – names of properties
asmasked (bool) – are masked.
- Returns
Two XTGeo GridProperty objects (dx, dy). XTGeo GridProperty objects containing dy.
Deprecated since version 3.0: This will be removed in 4.0. Use xtgeo.Grid.get_dx() and/or xtgeo.Grid.get_dy() instead.
-
get_dy(name='dY', asmasked=True, metric='horizontal')[source]¶ Return the dY as GridProperty object.
Returns the average length of y direction edges for each cell as a GridProperty. The length is by default horizontal vector length (see the metric parameter).
- Parameters
name (str) – names of properties
asmasked (bool) – are masked.
metric (str) – One of the following metrics: * “euclid”: sqrt(dx^2 + dy^2 + dz^2) * “horizontal”: sqrt(dx^2 + dy^2) * “east west vertical”: sqrt(dy^2 + dz^2) * “north south vertical”: sqrt(dx^2 + dz^2) * “x projection”: dx * “y projection”: dy * “z projection”: dz
- Returns
Two XTGeo GridProperty objects (dx, dy).
-
get_dz(name='dZ', flip=True, asmasked=True, mask=None, metric='z projection')[source]¶ Return the dZ as GridProperty object.
Returns the average length of z direction edges for each cell as a GridProperty. The length is by default the z delta, ie. projected onto the z dimension (see the metric parameter).
- Parameters
name (str) – name of property
flip (bool) – Use False for Petrel grids were Z is negative down (experimental)
asmasked (bool) – True if only for active cells, False for all cells
mask (bool) – Deprecated, use asmasked instead!
metric (str) – One of the following metrics: * “euclid”: sqrt(dx^2 + dy^2 + dz^2) * “horizontal”: sqrt(dx^2 + dy^2) * “east west vertical”: sqrt(dy^2 + dz^2) * “north south vertical”: sqrt(dx^2 + dz^2) * “x projection”: dx * “y projection”: dy * “z projection”: dz
- Returns
A XTGeo GridProperty object dZ
-
get_geometrics(allcells=False, cellcenter=True, return_dict=False, _ver=1)[source]¶ Get a list of grid geometrics such as origin, min, max, etc.
This returns a tuple: (xori, yori, zori, xmin, xmax, ymin, ymax, zmin, zmax, avg_rotation, avg_dx, avg_dy, avg_dz, grid_regularity_flag)
If a dictionary is returned, the keys are as in the list above.
- Parameters
allcells (bool) – If True, return also for inactive cells
cellcenter (bool) – If True, use cell center, otherwise corner coords
return_dict (bool) – If True, return a dictionary instead of a list, which is usually more convinient.
_ver (int) – Private option; only for developer!
Raises: Nothing
Example:
>>> mygrid = grid_from_file(reek_dir + "REEK.EGRID")
>>> gstuff = mygrid.get_geometrics(return_dict=True)
>>> print(f"X min/max is {gstuff['xmin']:.2f} {gstuff['xmax']:.2f}")
X min/max is 456620.79 467106.33
-
get_gridproperties()[source]¶ Return the
GridPropertiesinstance attached to the grid.See also the
gridprops()propertyDeprecated since version 2.16: This will be removed in 4.0. Use xtgeo.Grid().gridprops instead
-
get_gridquality_properties()[source]¶ Return a GridProperties() instance with grid quality measures.
These measures are currently:
minangle_topbase (degrees) - minimum angle of top and base
maxangle_topbase (degrees) - maximum angle of top and base
minangle_topbase_proj (degrees) min angle projected (bird view)
maxangle_topbase_proj (degrees) max angle projected (bird view)
minangle_sides (degress) minimum angle, all side surfaces
maxangle_sides (degress) maximum angle, all side surfaces
collapsed (int) Integer, 1 of one or more corners are collpased in Z
faulted (int) Integer, 1 if cell is faulted (one or more neighbours offset)
negative_thickness (int) Integer, 1 if cell has negative thickness
concave_proj (int) 1 if cell is concave seen from projected bird view
Example:
# store grid quality measures in RMS
gprops = grd.gridquality()
for gprop in gprops:
    gprop.to_roxar(project, "MyGrid", gprop.name)
-
get_ijk(names=('IX', 'JY', 'KZ'), asmasked=True, mask=None, zerobased=False)[source]¶ Returns 3 xtgeo.grid3d.GridProperty objects: I counter, J counter, K counter.
- Parameters
names – a 3 x tuple of names per property (default IX, JY, KZ).
asmasked – If True, UNDEF cells are masked, default is True
mask (bool) – Deprecated, use asmasked instead!
zerobased – If True, counter start from 0, otherwise 1 (default=1).
-
get_ijk_from_points(points, activeonly=True, zerobased=False, dataframe=True, includepoints=True, columnnames=('IX', 'JY', 'KZ'), fmt='int', undef=- 1)[source]¶ Returns a list/dataframe of cell indices based on a Points() instance.
If a point is outside the grid, -1 values are returned
- Parameters
points (Points) – A XTGeo Points instance
activeonly (bool) – If True, UNDEF cells are not included
zerobased (bool) – If True, counter start from 0, otherwise 1 (default=1).
dataframe (bool) – If True result is Pandas dataframe, otherwise a list of tuples
includepoints (bool) – If True, include the input points in result
columnnames (tuple) – Name of columns if dataframe is returned
fmt (str) – Format of IJK arrays (int/float). Default is “int”
undef (int or float) – Value to assign to undefined (outside) entries.
New in version 2.6.
Changed in version 2.8: Added keywords columnnames, fmt, undef
-
get_layer_slice(layer, top=True, activeonly=True)[source]¶ Get numpy arrays for cell coordinates e.g. for plotting.
In each cell there are 5 XY pairs, making a closed polygon as illustrated here:
XY3 < XY2 !~~~~~~~! ! ! ^ !~~~~~~~! XY0 -> XY1 XY4
Note that cell ordering is C ordering (row is fastest)
- Parameters
layer (int) – K layer, starting with 1 as topmost
tip (bool) – If True use top of cell, otherwise use base
activeonly (bool) – If True, only return active cells
- Returns
[[[X0, Y0], [X1, Y1]…[X4, Y4]], [[..][..]]…] icarray (np): On the form [ic1, ic2, …] where ic is cell count (C order)
- Return type
layerarray (np)
Example
Return two arrays forr cell corner for bottom layer:
grd = xtgeo.grid_from_file(REEKFILE)

parr, ibarr = grd.get_layer_slice(grd.nlay, top=False)
New in version 2.3.
-
get_randomline(fencespec, prop, zmin=None, zmax=None, zincrement=1.0, hincrement=None, atleast=5, nextend=2)[source]¶ Get a sampled randomline from a fence spesification.
This randomline will be a 2D numpy with depth on the vertical axis, and length along as horizontal axis. Undefined values will have the np.nan value.
The input fencespec is either a 2D numpy where each row is X, Y, Z, HLEN, where X, Y are UTM coordinates, Z is depth/time, and HLEN is a length along the fence, or a Polygons instance.
If input fencspec is a numpy 2D, it is important that the HLEN array has a constant increment and ideally a sampling that is less than the Grid resolution. If a Polygons() instance, this is automated if hincrement is None, and ignored if hincrement is False.
- Parameters
fencespec (
ndarrayorPolygons) – 2D numpy with X, Y, Z, HLEN as rows or a xtgeo Polygons() object.prop (GridProperty or str) – The grid property object, or name, which shall be plotted.
zmin (float) – Minimum Z (default is Grid Z minima/origin)
zmax (float) – Maximum Z (default is Grid Z maximum)
zincrement (float) – Sampling vertically, default is 1.0
hincrement (float or bool) – Resampling horizontally. This applies only if the fencespec is a Polygons() instance. If None (default), the distance will be deduced automatically. If False, then it assumes the Polygons can be used as-is.
atleast (int) – Minimum number of horizontal samples (only if fencespec is a Polygons instance and hincrement != False)
nextend (int) – Extend with nextend * hincrement in both ends (only if fencespec is a Polygons instance and hincrement != False)
- Returns
(hmin, hmax, vmin, vmax, ndarray2d)
- Return type
A tuple
- Raises
ValueError – Input fence is not according to spec.
Example:
mygrid = xtgeo.Grid("somegrid.roff")
poro = xtgeo.GridProperty("someporo.roff")
mywell = xtgeo.Well("somewell.rmswell")
fence = mywell.get_fence_polyline(sampling=5, tvdmin=1750, asnumpy=True)
(hmin, hmax, vmin, vmax, arr) = mygrid.get_randomline(
     fence, poro, zmin=1750, zmax=1850, zincrement=0.5,
)
# matplotlib ...
plt.imshow(arr, cmap="rainbow", extent=(hmin1, hmax1, vmax1, vmin1))
New in version 2.1.
See also
- Class
Polygons The method
get_fence()which can be used to pregenerate fencespec
-
get_subgrids()[source]¶ Get the subgrids on a simplified ordered dictionary.
The simplified dictionary is on the form {“name1”: 3, “name2”: 5}
-
get_vtk_esg_geometry_data()[source]¶ Get grid geometry data suitable for use with VTK’s vtkExplicitStructuredGrid.
Builds and returns grid geometry data in a format tailored for use with VTK’s explicit structured grid (ESG). Essentially this entails building an unstructured grid representation where all the grid cells are represented as hexahedrons with explicit connectivities. The cell connectivity array refers into the accompanying vertex array.
In VTK, cell order increases in I fastest, then J, then K.
The returned tuple contains: - numpy array with dimensions in terms of points (not cells) - vertex array, numpy array with vertex coordinates - connectivity array for all the cells, numpy array with integer indices - inactive cell indices, numpy array with integer indices
This function also tries to remove/weld duplicate vertices, but this is still a work in progress.
Example usage with VTK:
dims, vert_arr, conn_arr, inact_arr = xtg_grid.get_vtk_esg_geometry_data()

vert_arr = vert_arr.reshape(-1, 3)
vtk_points = vtkPoints()
vtk_points.SetData(numpy_to_vtk(vert_arr, deep=1))

vtk_cell_array = vtkCellArray()
vtk_cell_array.SetData(8, numpy_to_vtkIdTypeArray(conn_arr, deep=1))

vtk_esgrid = vtkExplicitStructuredGrid()
vtk_esgrid.SetDimensions(dims)
vtk_esgrid.SetPoints(vtk_points)
vtk_esgrid.SetCells(vtk_cell_array)

vtk_esgrid.ComputeFacesConnectivityFlagsArray()

ghost_arr_vtk = vtk_esgrid.AllocateCellGhostArray()
ghost_arr_np = vtk_to_numpy(ghost_arr_vtk)
ghost_arr_np[inact_arr] = vtkDataSetAttributes.HIDDENCELL
New in version 2.20.
-
get_vtk_geometries()[source]¶ Get necessary arrays on correct layout for VTK ExplicitStructuredGrid usage.
Example:
import pyvista as pv
dim, crn, inactind = grd.get_vtk_geometries()
grid = pv.ExplicitStructuredGrid(dim, crn)
grid.flip_z(inplace=True)
grid.hide_cells(inactind, inplace=True)
grid.plot(show_edges=True)
- Returns
dims, corners, inactive_indices
New in version 2.18.
-
get_xyz(names=('X_UTME', 'Y_UTMN', 'Z_TVDSS'), asmasked=True, mask=None)[source]¶ Returns 3 xtgeo.grid3d.GridProperty objects for x, y, z coordinates.
The values are mid cell values. Note that ACTNUM is ignored, so these is also extracted for UNDEF cells (which may have weird coordinates). However, the option asmasked=True will mask the numpies for undef cells.
- Parameters
names – a 3 x tuple of names per property (default is X_UTME,
Y_UTMN –
Z_TVDSS) –
asmasked – If True, then inactive cells is masked (numpy.ma).
mask (bool) – Deprecated, use asmasked instead!
-
get_xyz_cell_corners(ijk=(1, 1, 1), activeonly=True, zerobased=False)[source]¶ Return a 8 * 3 tuple x, y, z for each corner.
2       3
!~~~~~~~!
!  top  !
!~~~~~~~!    Listing corners with Python index (0 base)
0       1

6       7
!~~~~~~~!
!  base !
!~~~~~~~!
4       5
- Parameters
ijk (tuple) – A tuple of I J K (NB! cell counting starts from 1 unless zerobased is True)
activeonly (bool) – Skip undef cells if set to True.
- Returns
- A tuple with 24 elements (x1, y1, z1, … x8, y8, z8)
for 8 corners. None if cell is inactive and activeonly=True.
Example:
>>> grid = grid_from_file(reek_dir + "REEK.EGRID")
>>> print(grid.get_xyz_cell_corners(ijk=(10,13,2)))
(458704.10..., 1716.969970703125)
- Raises
RuntimeWarning if spesification is invalid. –
-
get_xyz_corners(names=('X_UTME', 'Y_UTMN', 'Z_TVDSS'))[source]¶ Returns 8*3 (24) xtgeo.grid3d.GridProperty objects, x, y, z for each corner.
The values are cell corner values. Note that ACTNUM is ignored, so these is also extracted for UNDEF cells (which may have weird coordinates).
2       3
!~~~~~~~!
!  top  !
!~~~~~~~!    Listing corners with Python index (0 base)
0       1

6       7
!~~~~~~~!
!  base !
!~~~~~~~!
4       5
- Parameters
names (list) – Generic name of the properties, will have a number added, e.g. X0, X1, etc.
Example:
>>> import xtgeo
>>> grid = xtgeo.create_box_grid((2,2,2))
>>> gps = grid.get_xyz_corners() # list of 24 grid properties
>>> len(gps)
24
>>> gps[0].values.tolist()
[[[0.0, 0.0], ... [[1.0, 1.0], [1.0, 1.0]]]
- Raises
RunetimeError if corners has wrong spesification –
-
get_zoneprop_from_subgrids()[source]¶ Make a XTGeo GridProperty instance for a Zone property subgrid index.
-
property
gridprops¶ Return or set a XTGeo GridProperties objects attached to the Grid.
-
property
ijk_handedness¶ IJK handedness for grids, “right” or “left”.
For a non-rotated grid with K increasing with depth, ‘left’ is corner in lower-left, while ‘right’ is origin in upper-left corner.
- Type
str
-
inactivate_inside(poly, layer_range=None, inside=True, force_close=False)[source]¶ Inacativate grid inside a polygon.
The Polygons instance may consist of several polygons. If a polygon is open, then the flag force_close will close any that are not open when doing the operations in the grid.
- Parameters
poly (Polygons) – A polygons object
layer_range (tuple) – A tuple of two ints, upper layer = 1, e.g. (1, 14). Note that base layer count is 1 (not zero)
inside (bool) – True if remove inside polygon
force_close (bool) – If True then force polygons to be closed.
- Raises
RuntimeError – If a problems with one or more polygons.
ValueError – If Polygon is not a XTGeo object
-
inactivate_outside(poly, layer_range=None, force_close=False)[source]¶ Inacativate grid outside a polygon.
-
make_zconsistent(zsep=1e-05)[source]¶ Make the 3D grid consistent in Z, by a minimal gap (zsep).
- Parameters
zsep (float) – Minimum gap
-
property
metadata¶ Return or set metadata instance of type MetaDataCPGeometry.
- Type
obj
-
property
nactive¶ Returns the number of active cells (read only).
- Type
int
-
property
name¶ Name attribute of grid.
- Type
str
-
property
ncol¶ Number of columns (read only).
- Type
int
-
property
nlay¶ Number of layers (read only).
- Type
int
-
property
nrow¶ Number of rows (read only).
- Type
int
-
property
ntotal¶ Returns the total number of cells (read only).
-
property
propnames¶ Returns a list of property names that are hooked to a grid.
-
property
props¶ Return or set a list of XTGeo GridProperty objects.
When setting, the dimension of the property object is checked, and will raise an IndexError if it does not match the grid.
When setting props, the current property list is replaced.
See also
append_prop()method to add a property to the current list.
-
reduce_to_one_layer()[source]¶ Reduce the grid to one single layer.
Example:
>>> import xtgeo
>>> grid = xtgeo.grid_from_file(reek_dir + "/REEK.EGRID")
>>> grid.nlay
14
>>> grid.reduce_to_one_layer()
>>> grid.nlay
1
-
refine_vertically(rfactor, zoneprop=None)[source]¶ Refine vertically, proportionally.
The rfactor can be a scalar or a dictionary.
If rfactor is a dict and zoneprop is None, then the current subgrids array is used. If zoneprop is defined, the current subgrid index will be redefined for the case. A warning will be issued if subgrids are defined, but the give zone property is inconsistent with this.
Also, if a zoneprop is defined but no current subgrids in the grid, then subgrids will be added to the grid, if more than 1 subgrid.
- Parameters
self (object) – A grid XTGeo object
rfactor (scalar or dict) – Refinement factor, if dict, then the dictionary must be consistent with self.subgrids if this is present.
zoneprop (GridProperty) – Zone property; must be defined if rfactor is a dict
- Returns
if.. RuntimeError: if mismatch in dimensions for rfactor and zoneprop
- Return type
ValueError
Examples:
# refine vertically all by factor 3

grd.refine_vertically(3)

# refine by using a dictionary; note that subgrids must exist!
# and that subgrids that are not mentioned will have value 1
# in refinement (1 is meaning no refinement)

grd.refine_vertically({1: 3, 2: 4, 4: 1})

# refine by using a a dictionary and a zonelog. If subgrids exists
# but are inconsistent with the zonelog; the current subgrids will
# be redefined, and a warning will be issued! Note also that ranges
# in the dictionary rfactor and the zone property must be aligned.

grd.refine_vertically({1: 3, 2: 4, 4: 0}, zoneprop=myzone)
-
rename_subgrids(names)[source]¶ Rename the names in the subgrids with the new names.
- Parameters
names (list) – List of new names, length of list must be same as length of subgrids
Example:
>>> from collections import OrderedDict
>>> grd = create_box_grid((3, 3, 3))
>>> grd.subgrids = OrderedDict(
...     [("1", range(1,2)), ("2", range(2,3)), ("3", range(3,4))]
... )
>>> grd.rename_subgrids(["Inky", "Tinky", "Pinky"])
- Raises
ValueError – Input names not a list or a tuple
ValueError – Lenght of names list not same as number of subgrids
New in version 2.12.
-
report_zone_mismatch(well=None, zonelogname='ZONELOG', zoneprop=None, onelayergrid=None, zonelogrange=(0, 9999), zonelogshift=0, depthrange=None, perflogname=None, perflogrange=(1, 9999), filterlogname=None, filterlogrange=(1e-32, 9999.0), resultformat=1)[source]¶ Reports mismatch between wells and a zone.
- Approaches on matching:
Use the well zonelog as basis, and compare sampled zone with that interval. This means that zone cells outside well range will not be counted
Compare intervals with wellzonation in range or grid zonations in range. This gives a wider comparison, and will capture cases where grid zonations is outside well zonation

Note if zonelogname and/or filterlogname and/or perflogname is given, and such log(s) are not present, then this function will return
None.- Parameters
well (Well) – a XTGeo well object
zonelogname (str) – Name of the zone logger
zoneprop (GridProperty) – Grid property instance to use for zonation
zonelogrange (tuple) – zone log range, from - to (inclusive)
onelayergrid (Grid) – Redundant from version 2.8, please skip!
zonelogshift (int) – Deviation (numerical shift) between grid and zonelog, e.g. if Zone property starts with 1 and this corresponds to a zonelog index of 3 in the well, the shift shall be -2.
depthrange (tuple) – Interval for search in TVD depth, to speed up
perflogname (str) – Name of perforation log to filter on (> 0 default).
perflogrange (tuple) – Range of values where perforations are present.
filterlogname (str) – General filter, work as perflog, filter on values > 0
filterlogrange (tuple) – Range of values where filter shall be present.
resultformat (int) – If 1, consider the zonelogrange in the well as basis for match ratio, return (percent, match count, total count). If 2 then a dictionary is returned with various result members
- Returns
- report dependent on resultformat
- A tuple with 3 members:
(match_as_percent, number of matches, total count) approach 1
- A dictionary with keys:
MATCH1 - match as percent, approach 1
MCOUNT1 - number of match samples approach 1
TCOUNT1 - total number of samples approach 1
MATCH2 - match as percent, approach 2
MCOUNT2 - a.a for option 2
TCOUNT2 - a.a. for option 2
WELLINTV - a Well() instance for the actual interval
None, if perflogname or zonelogname of filtername is given, but the log does not exists for the well
- Return type
res (tuple or dict)
Example:
g1 = xtgeo.Grid("gullfaks2.roff")

z = xtgeo.GridProperty(gullfaks2_zone.roff", name="Zone")

w2 = xtgeo.Well("34_10-1.w", zonelogname="Zonelog")

w3 = xtgeo.Well("34_10-B-21_B.w", zonelogname="Zonelog"))

wells = [w2, w3]

for w in wells:
    response = g1.report_zone_mismatch(
        well=w, zonelogname="ZONELOG", zoneprop=z,
        zonelogrange=(0, 19), depthrange=(1700, 9999))

    print(response)
Changed in version 2.8: Added several new keys and better precision in result
Changed in version 2.11: Added
perflograngeandfilterlogrange
-
reverse_row_axis(ijk_handedness=None)[source]¶ Reverse the row axis (J indices).
This means that IJK system will switched between a left vs right handed system. It is here (by using ijk_handedness key), possible to set a wanted stated.
Note that properties that are assosiated with the grid (through the
gridpropsorpropsattribute) will also be reversed (which is desirable).- Parameters
ijk_handedness (str) – If set to “right” or “left”, do only reverse rows if handedness is not already achieved.
Example:
grd = xtgeo.Grid("somefile.roff")
prop1 = xtgeo.GridProperty("somepropfile1.roff")
prop2 = xtgeo.GridProperty("somepropfile2.roff")

grd.props = [prop1, prop2]

# secure that the grid geometry is IJK right-handed
grd.reverse_row_axis(ijk_handedness="right")
New in version 2.5.
-
property
roxgrid¶ Get the Roxar native proj.grid_models[gname].get_grid() object.
-
property
roxindexer¶ The Roxar native proj.grid_models[gname].get_grid().grid_indexer object.
-
set_actnum(actnum)[source]¶ Modify the existing active cell index, ACTNUM.
- Parameters
actnum (GridProperty) – a gridproperty instance with 1 for active cells, 0 for inactive cells
- Example::
>>> mygrid = create_box_grid((5,5,5))
>>> act = mygrid.get_actnum()
>>> act.values[:, :, :] = 1
>>> act.values[:, :, 4] = 0
>>> mygrid.set_actnum(act)
-
set_subgrids(sdict)[source]¶ Set the subgrid from a simplified ordered dictionary.
The simplified dictionary is on the form {“name1”: 3, “name2”: 5}
Note that the input must be an OrderedDict!
-
property
subgrids¶ A dict with subgrid name and an array as value.
I.e. a dict on the form
{"name1": [1, 2, 3, 4], "name2": [5, 6, 7],
"name3": [8, 9, 10]}
, here meaning 3 subgrids where upper is 4 cells vertically, then 3, then 3. The numbers must sum to NLAY.The numbering in the arrays are 1 based; meaning uppermost layer is 1 (not 0).
None will be returned if no subgrid indexing is present.
See also
set_subgrids()andget_subgrids()which have a similar function, but differs a bit.Note that this design is a bit different from the Roxar API, where repeated sections are allowed, and where indices start from 0, not one.
- Type
listofint
-
subgrids_from_zoneprop(zoneprop)[source]¶ Estimate subgrid index from a zone property.
The new will esimate which will replace the current if any.
- Parameters
zoneprop (GridProperty) – a XTGeo GridProperty instance.
- Returns
- Will also return simplified dictionary is on the form
{“name1”: 3, “name2”: 5}
-
to_file(gfile, fformat='roff')[source]¶ Export grid geometry to file, various vendor formats.
- Parameters
gfile (str) – Name of output file
fformat (str) – File format; roff/roff_binary/roff_ascii/ grdecl/bgrdecl/egrid.
- Raises
OSError – Directory does not exist
- Example::
>>> grid = create_box_grid((2,2,2))
>>> grid.to_file(outdir + "/myfile.roff")
-
to_hdf(gfile, compression=None, chunks=False, subformat=844)[source]¶ Export grid geometry to HDF5 storage format (experimental!).
- Parameters
gfile (
Union[str,Path]) – Name of output filecompression (
Optional[str]) – Compression method, such as “blosc” or “lzf”chunks (
Optional[bool]) – chunks settingssubformat (
Optional[int]) – Format of output arrays in terms of bytes. E.g. 844 means 8 byte for COORD, 4 byte for ZCORNS, 4 byte for ACTNUM.
- Raises
OSError – Directory does not exist
- Return type
Path- Returns
Used file object, or None if memory stream
Example
>>> grid = create_box_grid((2,2,2))
>>> filename = grid.to_hdf(outdir + "/myfile_grid.h5")
-
to_roxar(project, gname, realisation=0, info=False, method='cpg')[source]¶ Export (upload) a grid from XTGeo to RMS via Roxar API.
Note
When project is file path (direct access, outside RMS) then
to_roxar()will implicitly do a project save. Otherwise, the project will not be saved until the user do an explicit project save action.- Parameters
project (str or roxar._project) – Inside RMS use the magic ‘project’, else use path to RMS project, or a project reference
gname (str) – Name of grid in RMS
realisation (int) – Realisation umber, default 0
info (bool) – TBD
method (str) – Save approach
-
to_xtgf(gfile, subformat=844)[source]¶ Export grid geometry to xtgeo native binary file format (experimental!).
- Parameters
gfile (
Union[str,Path]) – Name of output filesubformat (
Optional[int]) – Format of output arryas in terms of bytes. E.g. 844 means 8 byte for COORD, 4 byte for ZCORNS, 4 byte for ACTNUM.
- Raises
OSError – Directory does not exist
- Returns
- Used pathlib.Path file object, or None if
memory stream
- Return type
gfile (pathlib.Path)
- Example::
>>> grid = create_box_grid((2,2,2))
>>> filename = grid.to_xtgf(outdir + "/myfile.xtg")
-
translate_coordinates(translate=(0, 0, 0), flip=(1, 1, 1))[source]¶ Translate (move) and/or flip grid coordinates in 3D.
By ‘flip’ here, it means that the full coordinate array are multiplied with -1.
- Parameters
translate (tuple) – Translation distance in X, Y, Z coordinates
flip (tuple) – Flip array. The flip values must be 1 or -1.
- Raises
RuntimeError – If translation goes wrong for unknown reasons
-
property
vectordimensions¶ The storage grid array dimensions tuple of 3 integers (read only).
The tuple is (ncoord, nzcorn, nactnum).
- Type
3-tuple
Grid property (single)
Functions
-
xtgeo.gridproperty_from_file(*args, **kwargs)[source]¶ Make a GridProperty instance directly from file import.
For arguments, see
GridProperty.from_file()- Parameters
pfile (str) – Property file
args – See
GridProperty.from_file()kwargs – See
GridProperty.from_file().
Example:
>>> import xtgeo
>>> myporo = xtgeo.gridproperty_from_file(
...    reek_dir + '/reek_sim_poro.roff',
...    name="PORO"
... )
-
xtgeo.gridproperty_from_roxar(project, gname, pname, realisation=0, faciescodes=False)[source]¶ Make a GridProperty instance directly inside RMS.
For arguments, see
GridProperty.from_roxar()Example:
import xtgeo
myporo = xtgeo.gridproperty_from_roxar(project, 'Geogrid', 'Poro')
Classes
-
class
xtgeo.GridProperty(gridlike=None, ncol=None, nrow=None, nlay=None, name='unknown', discrete=False, date=None, grid=None, linkgeometry=True, fracture=False, codes=None, dualporo=False, dualperm=False, roxar_dtype=None, values=None, roxorigin=False, filesrc=None)[source]¶ Bases:
xtgeo.grid3d._grid3d._Grid3DClass for a single 3D grid property, e.g porosity or facies.
An GridProperty instance may or may not ‘belong’ to a grid (geometry) object. E.g. for ROFF input, ncol, nrow, nlay are given in the import file and the grid geometry file is not needed. For many Eclipse files, the grid geometry is needed as this holds the active number indices (ACTNUM).
Normally the instance is created when importing a grid property from file, but it can also be created directly, as e.g.:
poro = GridProperty(ncol=233, nrow=122, nlay=32)
The grid property values
someinstance.valuesby themselves is a 3D masked numpy usually as either float64 (double) or int32 (if discrete), and undefined cells are displayed as masked. The internal array order is now C_CONTIGUOUS. (i.e. not in Eclipse manner). A 1D view (C order) is achieved by the values1d property, e.g.:poronumpy = poro.values1d
Changed in version 2.6: Possible to make GridProperty instance directly from Grid()
Changed in version 2.8: Possible to base it on existing GridProperty() instance
Instantating.
- Args:
pfile: Input file-like or a Grid/GridProperty instance or leave blank. fformat: File format input, default is
guess. ncol: Number of columns (nx) defaults to 4. nrow: Number of rows (ny) defaults to 3. ncol: Number of layers (nz) defaults to 5. name: Name of property. discrete: True or False. date: Date on YYYYMMDD form. grid: Attached grid object linkgeometry: If True, establish a link between GridProperty and Grid fracture: True if fracture option (relevant for flow simulator data) codes: Codes in case a discrete property e.g. {1: “Sand”, 4: “Shale”} dualporo: True if dual porosity system. dualperm: True if dual porosity and dual permeability system. roxar_dtype: Spesify roxar datatype e.g. np.uint8 values: Values to apply (will not be applied if a file-like is input)
- Returns
A GridProperty object instance.
- Raises
RuntimeError – if something goes wrong (e.g. file not found)
- Parameters
ncol (Optional[int, None]) –
nrow (Optional[int, None]) –
nlay (Optional[int, None]) –
name (Optional[str, None]) –
discrete (Optional[bool, None]) –
date (Optional[str, None]) –
grid (Optional[Any, None]) –
linkgeometry (Optional[bool, None]) –
fracture (Optional[bool, None]) –
codes (Optional[dict, None]) –
dualporo (Optional[bool, None]) –
dualperm (Optional[bool, None]) –
roxar_dtype (Optional[Any, None]) –
values (Optional[Union[numpy.ndarray, float, int]]) –
roxorigin (bool) –
filesrc (Optional[str, None]) –
Examples:
from xtgeo.grid3d import GridProperty
myprop = GridProperty()
myprop.from_file('emerald.roff', name='PORO')

# or

values = np.ma.ones((12, 17, 10), dtype=np.float64),
myprop = GridProperty(ncol=12, nrow=17, nlay=10,
                      values=values, discrete=False,
                      name='MyValue')

# or

myprop = GridProperty('emerald.roff', name='PORO')

# or create properties from a Grid() instance

mygrid = Grid("grid.roff")
myprop1 = GridProperty(mygrid, name='PORO')
myprop2 = GridProperty(mygrid, name='FACIES', discrete=True, values=1,
                       linkgeometry=True)  # alternative 1
myprop2.geometry = mygrid  # alternative 2 to link grid geometry to property

# from Grid instance:
grd = Grid("somefile_grid_file")
myprop = GridProperty(grd, values=99, discrete=True)  # based on grd

# or from existing GridProperty instance:
myprop2 = GridProperty(myprop, values=99, discrete=False)  # based on myprop
Public Data Attributes:
metadataReturn metadata object instance of type MetaDataRegularSurface.
nameReturns or rename the property name.
dimensionsThe grid dimensions as a tuple of 3 integers (read only)
nactiveReturns the number of active cells (read only).
geometryReturns or set the linked geometry, i.e. the Grid instance).
actnum_indicesReturns the 1D ndarray which holds the indices for active cells given in 1D, C order (read only).
isdiscreteReturn True if property is discrete.
dtypeReturn or set the values numpy dtype.
filesrcReturn or set file src (if any)
roxar_dtypeReturn or set the roxar dtype (if any)
dateReturns or rename the property date as string on YYYYMMDD format.
codesThe property codes as a dictionary.
ncodesNumber of codes if discrete grid property (read only).
valuesReturn or set the grid property as a masked 3D numpy array
ntotalReturns total number of cells ncol*nrow*nlay (read only)
roxoriginReturns True if the property comes from ROXAPI
values3dFor backward compatibility (use values instead)
values1dReturns a 1D view of values (masked numpy) (read only).
undefGet the actual undef value for floats or ints numpy arrays (read only).
undef_limitReturns the undef limit number, which is slightly less than the undef value.
Inherited from
_Grid3DncolReturns the NCOL (NX or Ncolumns) number of cells.
nrowReturns the NROW (NY or Nrows) number of cells.
nlayReturns the NLAY (NZ or Nlayers) number of cells.
Public Methods:
generate_hash()str: Return a unique hash ID for current grid; can e.g.
methods()Returns the names of the methods in the class.
ensure_correct_values(ncol, nrow, nlay, invalues)Ensures that values is a 3D masked numpy (ncol, nrol, nlay).
from_file(pfile[, fformat])Import grid property from file, and makes an instance of this class.
to_file(pfile[, fformat, name, append, …])Export the grid property to file.
from_roxar(projectname, gname, pname[, …])Import grid model property from RMS project, and makes an instance.
to_roxar(project, gname, pname[, …])Store a grid model property into a RMS project.
describe([flush])Describe an instance by printing to stdout
get_npvalues3d([fill_value])Get a pure numpy copy (not masked) copy of the values, 3D shape.
get_actnum([name, asmasked, mask])Return an ACTNUM GridProperty object.
get_active_npvalues1d()Return the grid property as a 1D numpy array (copy), active cells only.
get_npvalues1d([activeonly, fill_value, order])Return the grid property as a 1D numpy array (copy) for active or all cells, but inactive have a fill value.
copy([newname])Copy a xtgeo.grid3d.GridProperty() object to another instance.
mask_undef()Make UNDEF values masked.
crop(spec)Crop a property, see method under grid
get_xy_value_lists([grid, activeonly])Get lists of xy coords and values for Webportal format.
get_values_by_ijk(iarr, jarr, karr[, base])Get a 1D ndarray of values by I J K arrays.
discrete_to_continuous()Convert from discrete to continuous values
continuous_to_discrete()Convert from continuous to discrete values
operation_polygons(poly, value[, opname, inside])A generic function for doing 3D grid property operations restricted to inside or outside polygon(s).
add_inside(poly, value)Add a value (scalar) inside polygons
add_outside(poly, value)Add a value (scalar) outside polygons
sub_inside(poly, value)Subtract a value (scalar) inside polygons
sub_outside(poly, value)Subtract a value (scalar) outside polygons
mul_inside(poly, value)Multiply a value (scalar) inside polygons
mul_outside(poly, value)Multiply a value (scalar) outside polygons
div_inside(poly, value)Divide a value (scalar) inside polygons
div_outside(poly, value)Divide a value (scalar) outside polygons
set_inside(poly, value)Set a value (scalar) inside polygons
set_outside(poly, value)Set a value (scalar) outside polygons
-
__init__(gridlike=None, ncol=None, nrow=None, nlay=None, name='unknown', discrete=False, date=None, grid=None, linkgeometry=True, fracture=False, codes=None, dualporo=False, dualperm=False, roxar_dtype=None, values=None, roxorigin=False, filesrc=None)[source]¶ Instantating.
- Args:
pfile: Input file-like or a Grid/GridProperty instance or leave blank. fformat: File format input, default is
guess. ncol: Number of columns (nx) defaults to 4. nrow: Number of rows (ny) defaults to 3. ncol: Number of layers (nz) defaults to 5. name: Name of property. discrete: True or False. date: Date on YYYYMMDD form. grid: Attached grid object linkgeometry: If True, establish a link between GridProperty and Grid fracture: True if fracture option (relevant for flow simulator data) codes: Codes in case a discrete property e.g. {1: “Sand”, 4: “Shale”} dualporo: True if dual porosity system. dualperm: True if dual porosity and dual permeability system. roxar_dtype: Spesify roxar datatype e.g. np.uint8 values: Values to apply (will not be applied if a file-like is input)
- Returns
A GridProperty object instance.
- Raises
RuntimeError – if something goes wrong (e.g. file not found)
- Parameters
ncol (Optional[int, None]) –
nrow (Optional[int, None]) –
nlay (Optional[int, None]) –
name (Optional[str, None]) –
discrete (Optional[bool, None]) –
date (Optional[str, None]) –
grid (Optional[Any, None]) –
linkgeometry (Optional[bool, None]) –
fracture (Optional[bool, None]) –
codes (Optional[dict, None]) –
dualporo (Optional[bool, None]) –
dualperm (Optional[bool, None]) –
roxar_dtype (Optional[Any, None]) –
values (Optional[Union[numpy.ndarray, float, int]]) –
roxorigin (bool) –
filesrc (Optional[str, None]) –
Examples:
from xtgeo.grid3d import GridProperty
myprop = GridProperty()
myprop.from_file('emerald.roff', name='PORO')

# or

values = np.ma.ones((12, 17, 10), dtype=np.float64),
myprop = GridProperty(ncol=12, nrow=17, nlay=10,
                      values=values, discrete=False,
                      name='MyValue')

# or

myprop = GridProperty('emerald.roff', name='PORO')

# or create properties from a Grid() instance

mygrid = Grid("grid.roff")
myprop1 = GridProperty(mygrid, name='PORO')
myprop2 = GridProperty(mygrid, name='FACIES', discrete=True, values=1,
                       linkgeometry=True)  # alternative 1
myprop2.geometry = mygrid  # alternative 2 to link grid geometry to property

# from Grid instance:
grd = Grid("somefile_grid_file")
myprop = GridProperty(grd, values=99, discrete=True)  # based on grd

# or from existing GridProperty instance:
myprop2 = GridProperty(myprop, values=99, discrete=False)  # based on myprop
-
property
actnum_indices¶ Returns the 1D ndarray which holds the indices for active cells given in 1D, C order (read only).
-
property
codes¶ The property codes as a dictionary.
- Return type
dict
-
copy(newname=None)[source]¶ Copy a xtgeo.grid3d.GridProperty() object to another instance.
>>> import xtgeo
>>> myporo = xtgeo.gridproperty_from_file(
...    reek_dir + '/reek_sim_poro.roff',
...    name="PORO"
... )
>>> mycopy = myporo.copy(newname='XPROP')
>>> print(mycopy.name)
XPROP
-
property
date¶ Returns or rename the property date as string on YYYYMMDD format.
- Return type
Optional[str]
-
property
dimensions¶ The grid dimensions as a tuple of 3 integers (read only)
- Type
3-tuple
-
property
dtype¶ Return or set the values numpy dtype.
When setting, note that the the dtype must correspond to the isdiscrete property. Hence dtype cannot alter isdiscrete status
Example:
if myprop.isdiscrete:
    myprop.dtype = np.uint16
-
ensure_correct_values(ncol, nrow, nlay, invalues)[source]¶ Ensures that values is a 3D masked numpy (ncol, nrol, nlay).
- Parameters
ncol (int) – Number of columns.
nrow (int) – Number of rows.
nlay (int) – Number of layers.
invalues (array or scalar) – Values to process.
- Returns
Numpy masked array on correct format.
- Return type
values (MaskedArray)
-
property
filesrc¶ Return or set file src (if any)
-
from_file(pfile, fformat=None, **kwargs)[source]¶ Import grid property from file, and makes an instance of this class.
Note that the the property may be linked to its geometrical grid, through the
grid=option. Sometimes this is required, for instance for most Eclipse input.- Parameters
pfile (str) – name of file to be imported
fformat (str) – file format to be used roff/init/unrst/grdecl (None is default, which means “guess” from file extension).
name (str) – name of property to import
date (int or str) – For restart files, date on YYYYMMDD format. Also the YYYY-MM-DD form is allowed (string), and for Eclipse, mnemonics like ‘first’, ‘last’ is also allowed.
grid (Grid object) – Grid Object for checks (optional for ROFF, required for Eclipse).
gridlink (bool) – If True, and grid is not None, a link from the grid instance to the property is made. If False, no such link is made. Avoiding gridlink is recommended when running statistics of multiple realisations of a property.
fracture (bool) – Only applicable for DUAL POROSITY systems, if True then the fracture property is read; if False then the matrix property is read. Names will be appended with “M” or “F”
ijrange (list-like) – A list of 4 number: (i1, i2, j1, j2) for subrange of cells to read. Only applicable for xtgcpprop format.
zerobased (bool) – Input if cells counts are zero- or one-based in ijrange. Only applicable for xtgcpprop format.
Examples:
x = GridProperty()
x.from_file('somefile.roff', fformat='roff')
#
mygrid = Grid('ECL.EGRID')
pressure_1 = GridProperty()
pressure_1.from_file('ECL.UNRST', name='PRESSURE', date='first',
                     grid=mygrid)
- Returns
True if success, otherwise False
Changed in version 2.8: Added gridlink option, default is True
-
from_roxar(projectname, gname, pname, realisation=0, faciescodes=False)[source]¶ Import grid model property from RMS project, and makes an instance.
- Parameters
projectname (str) – Name of RMS project; use pure ‘project’ if inside RMS
gfile (str) – Name of grid model
pfile (str) – Name of grid property
realisation (int) – Realisation number (default 0; first)
faciescodes (bool) – If a Roxar property is of the special
body_faciestype (e.g. result from a channel facies object modelling), the default is to get the body code values. If faciescodes is True, the facies code values will be read instead. For other roxar properties this key is not relevant.
New in version 2.12: Key faciescodes was added
-
generate_hash()[source]¶ str: Return a unique hash ID for current grid; can e.g. be used to compare two gridproperty instances with same source.
New in version 2.10.
-
property
geometry¶ Returns or set the linked geometry, i.e. the Grid instance)
-
get_active_npvalues1d()[source]¶ Return the grid property as a 1D numpy array (copy), active cells only.
-
get_actnum(name='ACTNUM', asmasked=False, mask=None)[source]¶ Return an ACTNUM GridProperty object.
Note that this method is similar to, but not identical to, the job with same name in Grid(). Here, the maskedarray of the values is applied to deduce the ACTNUM array.
- Parameters
name (str) – name of property in the XTGeo GridProperty object.
asmasked (bool) – Actnum is returned with all cells shown as default. Use asmasked=True to make 0 entries masked.
mask (bool) – Deprecated, use asmasked instead!
Example:
act = mygrid.get_actnum()
print('{}% cells are active'.format(act.values.mean() * 100))
-
get_npvalues1d(activeonly=False, fill_value=nan, order='C')[source]¶ Return the grid property as a 1D numpy array (copy) for active or all cells, but inactive have a fill value.
- Parameters
activeonly (bool) – If True, then only return active cells
fill_value (float) – Fill value for inactive cells
order (str) – Array internal order; default is “C”, alternative is “F”
New in version 2.3.
Changed in version 2.8: Added fill_value and order
-
get_npvalues3d(fill_value=None)[source]¶ Get a pure numpy copy (not masked) copy of the values, 3D shape.
Note that Numpy dtype will be reset; int32 if discrete or float64 if continuous. The reason for this is to avoid inconsistensies regarding UNDEF values.
If fill_value is not None, than the returning dtype is always np.float64.
- Parameters
fill_value – Value of masked entries. Default is None which means the XTGeo UNDEF value (a high number), different for a continuous or discrete property
-
get_values_by_ijk(iarr, jarr, karr, base=1)[source]¶ Get a 1D ndarray of values by I J K arrays.
This could for instance be a well path where I J K exists as well logs.
Note that the input arrays have 1 as base as default
- Parameters
iarr (ndarray) – Numpy array of I
jarr (ndarray) – Numpy array of J
karr (ndarray) – Numpy array of K
base (int) – Should be 1 or 0, dependent on what number base the input arrays has.
- Returns
- A 1D numpy array of property values,
with NaN if undefined
- Return type
pvalues (ndarray)
-
get_xy_value_lists(grid=None, activeonly=True)[source]¶ Get lists of xy coords and values for Webportal format.
The coordinates are on the form (two cells):
[[[(x1,y1), (x2,y2), (x3,y3), (x4,y4)],
[(x5,y5), (x6,y6), (x7,y7), (x8,y8)]]]
- Parameters
grid (object) – The XTGeo Grid object for the property
activeonly (bool) – If true (default), active cells only, otherwise cell geometries will be listed and property will have value -999 in undefined cells.
Example:
grid = Grid()
grid.from_file('../xtgeo-testdata/3dgrids/bri/b_grid.roff')
prop = GridProperty()
prop.from_file('../xtgeo-testdata/3dgrids/bri/b_poro.roff',
               grid=grid, name='PORO')

clist, valuelist = prop.get_xy_value_lists(grid=grid,
                                           activeonly=False)
-
property
isdiscrete¶ Return True if property is discrete.
This can also be used to convert from continuous to discrete or from discrete to continuous:
myprop.isdiscrete = False
-
property
metadata¶ Return metadata object instance of type MetaDataRegularSurface.
-
classmethod
methods()[source]¶ Returns the names of the methods in the class.
>>> print(GridProperty.methods())
METHODS for GridProperty():
======================
__init__
_reset
_set_initial_dimensions
_check_dimensions_match
...
-
property
nactive¶ Returns the number of active cells (read only).
- Type
int
-
property
name¶ Returns or rename the property name.
-
property
ncodes¶ Number of codes if discrete grid property (read only).
- Return type
int
-
property
ncol¶ Returns the NCOL (NX or Ncolumns) number of cells.
- Return type
int
-
property
nlay¶ Returns the NLAY (NZ or Nlayers) number of cells.
- Return type
int
-
property
nrow¶ Returns the NROW (NY or Nrows) number of cells.
- Return type
int
-
property
ntotal¶ Returns total number of cells ncol*nrow*nlay (read only)
- Return type
int
-
operation_polygons(poly, value, opname='add', inside=True)[source]¶ A generic function for doing 3D grid property operations restricted to inside or outside polygon(s).
This method requires that the property geometry is known (prop.geometry is set to a grid instance)
- Parameters
poly (Polygons) – A XTGeo Polygons instance
value (float) – Value to add, subtract etc
opname (str) – Name of operation… ‘add’, ‘sub’, etc
inside (bool) – If True do operation inside polygons; else outside.
-
property
roxar_dtype¶ Return or set the roxar dtype (if any)
-
property
roxorigin¶ Returns True if the property comes from ROXAPI
-
to_file(pfile, fformat='roff', name=None, append=False, dtype=None, fmt=None)[source]¶ Export the grid property to file.
- Parameters
pfile (str or Path) – File name or pathlib.Path to export to
fformat (str) – The file format to be used. Default is roff binary , else roff_ascii/grdecl/bgrdecl
name (str) – If provided, will explicitly give property name; else the existing name of the instance will used.
append (bool) – Append to existing file, only for (b)grdecl formats.
dtype (str) – Data type; this is valid only for grdecl or bgrdecl formats, where default is None which means ‘float32’ for floating point number and ‘int32’ for discrete properties. Other choices are ‘float64’ which are ‘DOUB’ entries in Eclipse formats.
fmt (str) – Format for ascii grdecl format, default is None. If spesified, the user is responsible for a valid format specifier, e.g. “%8.4f”
Example:
# This example demonstrates that file formats can be mixed
rgrid = Grid('reek.roff')
poro = GridProperty('reek_poro.grdecl', grid=rgrid, name='PORO')

poro.values += 0.05

poro.to_file('reek_export_poro.bgrdecl', format='bgrdecl')
New in version 2.13: Key fmt was added and default format for float output to grdecl is now “%e” if fmt=None
-
to_roxar(project, gname, pname, realisation=0, casting='unsafe')[source]¶ Store a grid model property into a RMS project.
Note
When project is file path (direct access, outside RMS) then
to_roxar()will implicitly do a project save. Otherwise, the project will not be saved until the user do an explicit project save action.Note
Beware values casting, see
castingkey. Default is “unsafe” which may create issues if your property has values that is outside the valid range. I.e. for float values XTGeo normally use float64 (8 byte) while roxar use float32 (4 byte). With extreme values, e.g. 10e40, such values will be truncated if “unsafe” casting. More common is casting issues with discrete as Roxar (RMS) often use uint8 which only allow values in range 1..256.- Parameters
project (str or roxar._project) – Inside RMS use the magic ‘project’, else use path to RMS project, or a project reference
gfile (str) – Name of grid model
pfile (str) – Name of grid property
projectname (str) – Name of RMS project (None if inside a project)
realisation (int) – Realisation number (default 0 first)
casting (str) – This refers to numpy astype(… casting=…) settings.
New in version 2.12: Key casting was added
-
property
undef¶ Get the actual undef value for floats or ints numpy arrays (read only).
-
property
undef_limit¶ Returns the undef limit number, which is slightly less than the undef value.
Hence for numerical precision, one can force undef values to a given number, e.g.:
x[x<x.undef_limit]=999
Undef limit values cannot be changed (read only).
-
property
values¶ Return or set the grid property as a masked 3D numpy array
- Return type
MaskedArray
-
property
values1d¶ Returns a 1D view of values (masked numpy) (read only).
-
property
values3d¶ For backward compatibility (use values instead)
Grid properties (multiple)
Classes
-
class
xtgeo.GridProperties(ncol=None, nrow=None, nlay=None, props=None)[source]¶ Bases:
xtgeo.grid3d._grid3d._Grid3DClass for a collection of 3D grid props, belonging to the same grid topology.
It is a thin wrapper on a list that 1) checks that the GridProperties belong to the same Grid (loosely). 2) Contains operations that can be called on lists of GridProperty objects for easy discoverability.
- Examples::
>>> import xtgeo
>>> # Create an
>>> grid_properties = xtgeo.GridProperties(props=[])
>>> # Get the dataframe via the gridproperties object
>>> grid_properties.get_dataframe()
Empty DataFrame...
>>> # Convert the gridproperties to a list
>>> grid_properties_list = list(grid_properties)
>>> # Get the dataframe of the list:
>>> gridproperties_dataframe(grid_properties_list)
Empty DataFrame...
- Parameters
ncol (
Optional[int]) – Deprecated argument.nrow (
Optional[int]) – Deprecated argument.nlay (
Optional[int]) – Deprecated argument.props (
List[GridProperty]) – The list of GridProperty objects.
See also
The
GridPropertyclass.Public Data Attributes:
namesReturns a list of property names.
propsReturns a list of XTGeo GridProperty objects, None if empty.
datesReturns a list of valid (found) dates after import.
Inherited from
_Grid3DncolReturns the NCOL (NX or Ncolumns) number of cells.
nrowReturns the NROW (NY or Nrows) number of cells.
nlayReturns the NLAY (NZ or Nlayers) number of cells.
Public Methods:
copy()Copy a GridProperties instance to a new unique instance.
describe([flush])Describe an instance by printing to stdout.
generate_hash()str: Return a unique hash ID for current gridproperties instance.
get_prop_by_name(name[, raiseserror])Find and return a property object (GridProperty) by name.
append_props(proplist)Add a list of GridProperty objects to current GridProperties instance.
get_ijk([names, zerobased, asmasked, mask])Returns 3 xtgeo.grid3d.GridProperty objects: I counter, J counter, K counter.
get_actnum([name, asmasked, mask])Return an ACTNUM GridProperty object.
from_file(pfile[, fformat, names, dates, …])Import grid properties from file in one go.
get_dataframe([activeonly, ijk, xyz, …])Returns a Pandas dataframe table for the properties.
dataframe(*args, **kwargs)Deprecated since version 2.16.
scan_keywords(pfile[, fformat, maxkeys, …])Quick scan of keywords in Eclipse binary files, or ROFF binary files.
scan_dates(pfile[, fformat, maxdates, …])Quick scan dates in a simulation restart file.
-
__init__(ncol=None, nrow=None, nlay=None, props=None)[source]¶ Initialize self. See help(type(self)) for accurate signature.
- Parameters
ncol (Optional[int, None]) –
nrow (Optional[int, None]) –
nlay (Optional[int, None]) –
props (List[xtgeo.grid3d.grid_property.GridProperty]) –
-
append_props(proplist)[source]¶ Add a list of GridProperty objects to current GridProperties instance.
-
copy()[source]¶ Copy a GridProperties instance to a new unique instance.
Note that the GridProperty instances will also be unique.
-
dataframe(*args, **kwargs)[source]¶ Deprecated since version 2.16: This will be removed in 4.0. Use GridProperty.get_dataframe() instead
-
property
dates¶ Returns a list of valid (found) dates after import.
Returns None if no dates present
Note
See also
GridProperties.scan_dates()for scanning available dates in advanceExample:
>>> import xtgeo
>>> grid = xtgeo.grid_from_file(reek_dir + "/REEK.EGRID")
>>> props = GridProperties()
>>> props.from_file(
...     reek_dir + "/REEK.INIT",
...     fformat="init",
...     names=["PERMX"],
...     grid=grid,
... )

>>> datelist = props.dates
>>> for date in datelist:
...     print ('Date applied is {}'.format(date))
Date applied is 19991201
Changed in version 2.16: dates is no longer an alias (undocumented behavior), and simply return the dates of the underlying list of GridProperty.
-
from_file(pfile, fformat='roff', names=None, dates=None, grid=None, namestyle=0, strict=(True, False))[source]¶ Import grid properties from file in one go.
This class is particulary useful for Eclipse INIT and RESTART files.
In case of names=’all’ then all vectors which have a valid length (number of total or active cells in the grid) will be read
- Parameters
pfile (str or Path) – Name of file with properties
fformat (str) – roff/init/unrst
names – list of property names, e.g. [‘PORO’, ‘PERMX’] or ‘all’
dates – list of dates on YYYYMMDD format, for restart files, or ‘all’
grid (obj) – The grid geometry object (optional if ROFF)
namestyle (int) – 0 (default) for style SWAT_20110223, 1 for SWAT–2011_02_23 (applies to restart only)
strict (tuple of (bool, bool)) – If (True, False) (default) then an Error is raised if keyword name is not found, or a key-date combination is not found. However, the dates will processed so that non-valid dates are skipped (still, invalid key-date combinations may occur!). If (True, True) all keywords and dates are tried, while (False, False) means that that only valid entries are imported, more or less silently. Saturations keywords SWAT/SOIL/SGAS are not evaluated as they may be derived.
- Example::
>>> import xtgeo
>>> grid = xtgeo.grid_from_file(reek_dir + "/REEK.EGRID")
>>> props = GridProperties()
>>> props.from_file(
...     reek_dir + "/REEK.INIT",
...     fformat="init",
...     names=["PERMX"],
...     grid=grid,
... )
- Raises
FileNotFoundError – if input file is not found
DateNotFoundError – The date is not found
KeywordNotFoundError – The keyword is not found
KeywordFoundDateNotFoundError – The keyword but not date found
New in version 2.13: Added strict key
Deprecated since version 2.16: This will be removed in 4.0. Use xtgeo.gridproperties_from_file() instead
-
generate_hash()[source]¶ str: Return a unique hash ID for current gridproperties instance.
New in version 2.10.
-
get_actnum(name='ACTNUM', asmasked=False, mask=None)[source]¶ Return an ACTNUM GridProperty object.
- Parameters
name (str) – name of property in the XTGeo GridProperty object.
asmasked (bool) – ACTNUM is returned with all cells as default. Use asmasked=True to make 0 entries masked.
mask (bool) – Deprecated, use asmasked instead.
Example:
>>> import xtgeo
>>> grid = xtgeo.grid_from_file(reek_dir + "/REEK.EGRID")
>>> myprops = GridProperties()
>>> myprops.from_file(
...     reek_dir + "/REEK.INIT",
...     fformat="init",
...     names=["PERMX"],
...     grid=grid,
... )
>>> act = myprops.get_actnum()
>>> print('{}% of cells are active'.format(act.values.mean() * 100))
99.99...% of cells are active
- Returns
A GridProperty instance of ACTNUM, or None if no props present.
-
get_dataframe(activeonly=False, ijk=False, xyz=False, doubleformat=False, grid=None)[source]¶ Returns a Pandas dataframe table for the properties.
See also
xtgeo.gridproperties_dataframe()- Parameters
activeonly (bool) – If True, return only active cells, NB! If True, will require a grid instance (see grid key)
ijk (bool) – If True, show cell indices, IX JY KZ columns
xyz (bool) – If True, show cell center coordinates (needs grid).
doubleformat (bool) – If True, floats are 64 bit, otherwise 32 bit. Note that coordinates (if xyz=True) is always 64 bit floats.
grid (Grid) – The grid geometry object. This is required for the xyz option.
- Returns
Pandas dataframe object
Examples:
>>> import xtgeo
>>> grid = xtgeo.grid_from_file(reek_dir + "/REEK.EGRID")
>>> pps.grid_properties_from_file(
...     reek_dir + "/REEK.UNRST",
...     fformat="unrst",
...     names=['SOIL', 'SWAT', 'PRESSURE'],
...     dates=[19991201],
...     grid=grid,
... )
>>> df = pps.get_dataframe(activeonly=False, ijk=True, xyz=True, grid=grid)
>>> print(df)
       ACTNUM  IX  JY  ...  SOIL_19991201  SWAT_19991201  PRESSURE_19991201
0           1   1   1  ...            0.0            1.0         341.694183
1           1   1   1  ...            0.0            1.0         342.097107
2           1   1   1  ...            0.0            1.0         342.500061
3           1   1   1  ...            0.0            1.0         342.902954
4           1   1   1  ...            0.0            1.0         343.305908
...
-
get_ijk(names=('IX', 'JY', 'KZ'), zerobased=False, asmasked=False, mask=None)[source]¶ Returns 3 xtgeo.grid3d.GridProperty objects: I counter, J counter, K counter.
- Parameters
names – a 3 x tuple of names per property (default IX, JY, KZ).
asmasked – If True, then active cells only.
mask – If True, then active cells only (deprecated).
zerobased – If True, counter start from 0, otherwise 1 (default=1).
-
get_prop_by_name(name, raiseserror=True)[source]¶ Find and return a property object (GridProperty) by name.
- Parameters
name (str) – Name of property to look for
raiseserror (bool) – If True, raises a ValueError if not found, otherwise return None
-
property
names¶ Returns a list of property names.
Example:
>>> import xtgeo
>>> grid = xtgeo.grid_from_file(reek_dir + "/REEK.EGRID")
>>> props = GridProperties()
>>> props.from_file(
...     reek_dir + "/REEK.INIT",
...     fformat="init",
...     names=["PERMX"],
...     grid=grid,
... )

>>> namelist = props.names
>>> for name in namelist:
...     print ('Property name is {}'.format(name))
Property name is PERMX
-
property
ncol¶ Returns the NCOL (NX or Ncolumns) number of cells.
- Return type
int
-
property
nlay¶ Returns the NLAY (NZ or Nlayers) number of cells.
- Return type
int
-
property
nrow¶ Returns the NROW (NY or Nrows) number of cells.
- Return type
int
-
property
props¶ Returns a list of XTGeo GridProperty objects, None if empty.
Example:
>>> import xtgeo
>>> grid = xtgeo.grid_from_file(reek_dir + "/REEK.EGRID")
>>> myprops = GridProperties()
>>> myprops.from_file(
...     reek_dir + "/REEK.INIT",
...     fformat="init",
...     names=["PERMX"],
...     grid=grid,
... )

>>> proplist = myprops.props
>>> for prop in proplist:
...     print ('Property object name is {}'.format(prop.name))
Property object name is PERMX

>>> # adding a property, e.g. get ACTNUM as a property from the grid
>>> actn = grid.get_actnum()  # this will get actn as a GridProperty
>>> myprops.append_props([actn])
-
static
scan_dates(pfile, fformat='unrst', maxdates=1000, dataframe=False, datesonly=False)[source]¶ Quick scan dates in a simulation restart file.
- Parameters
pfile (str) – Name of file or file handle with properties
fformat (str) – unrst (so far)
maxdates (int) – Maximum number of dates to collect
dataframe (bool) – If True, return a Pandas dataframe instead
datesonly (bool) – If True, SEQNUM is skipped,
- Returns
A list of tuples or a dataframe with (seqno, date), date is on YYYYMMDD form. If datesonly is True and dataframe is False, the returning list will be a simple list of dates.
- Example::
>>> dlist = GridProperties.scan_dates(reek_dir + "/REEK.UNRST")
>>> #or getting all dates a simple list:
>>> dlist = GridProperties.scan_dates(
... reek_dir + "/REEK.UNRST",
... datesonly=True)
Changed in version 2.13: Added datesonly keyword
-
static
scan_keywords(pfile, fformat='xecl', maxkeys=1000000, dataframe=False, dates=False)[source]¶ Quick scan of keywords in Eclipse binary files, or ROFF binary files.
For Eclipse files: Returns a list of tuples (or dataframe), e.g. (‘PRESSURE’, ‘REAL’, 355299, 3582700), where (keyword, type, no_of_values, byteposition_in_file)
For ROFF files Returns a list of tuples (or dataframe), e.g. (‘translate!xoffset’, ‘float’, 1, 3582700), where (keyword, type, no_of_values, byteposition_in_file).
For Eclipse, the byteposition is to the KEYWORD, while for ROFF the byte position is to the beginning of the actual data.
- Parameters
pfile (str) – Name or a filehandle to file with properties
fformat (str) – xecl (Eclipse INIT, RESTART, …) or roff for ROFF binary,
maxkeys (int) – Maximum number of keys
dataframe (bool) – If True, return a Pandas dataframe instead
dates (bool) – if True, the date is the last column (only menaingful for restart files). Default is False.
- Returns
A list of tuples or dataframe with keyword info
- Example::
>>> dlist = GridProperties.scan_keywords(reek_dir + "/REEK.UNRST")
Other
Roxar utilities
RoxUtils
-
class
xtgeo.RoxUtils(project, readonly=False)[source]¶ Bases:
objectClass RoxUtils, for accessing project level methods:
import xtgeo

xr = xtgeo.RoxUtils(project)
xr.create_horizon_category('DS_extracted_run3')
xr.delete_horizon_category('DS_extracted_run2')
The project itself can be a reference to an existing project, typically the magic
projectwording inside RMS python, or a file path to a RMS project (for external access).- Parameters
project (roxar.Project or str) – Reference to a RMS project either an existing instance or a RMS project folder path.
readonly (bool) – saved to this project (which is the case for “secondary” projects).
Examples:
import xgeo
path = '/some/path/to/rmsprject.rmsx'

ext = xtgeo.RoxUtils(path, readonly=True)
# ...do something
ext.safe_close()
Public Data Attributes:
roxversionRoxar API version (read only)
projectThe Roxar project instance (read only)
Public Methods:
safe_close()Close the project but only if roxarapps (external) mode, i.e. not current RMS project.
version_required(targetversion)Defines a minimum ROXAPI version for some feature (True or False).
rmsversion(apiversion)Get the actual RMS version(s) given an API version.
create_horizons_category(category[, domain, …])Create one or more a Horizons category entries.
create_zones_category(category[, domain, htype])Create one or more a Horizons category entries.
delete_horizons_category(category)Delete on or more horizons or zones categories
delete_zones_category(category)Delete on or more horizons or zones categories.
clear_horizon_category(category)Clear (or make empty) the content of one or more horizon categories.
clear_zone_category(category)Clear (or make empty) the content of one or more zone categories.
-
__init__(project, readonly=False)[source]¶ Initialize self. See help(type(self)) for accurate signature.
-
clear_horizon_category(category)[source]¶ Clear (or make empty) the content of one or more horizon categories.
- Parameters
category (str or list) – Name(s) of category to empty, either as a simple string or a list of strings.
New in version 2.1.
-
clear_zone_category(category)[source]¶ Clear (or make empty) the content of one or more zone categories.
- Parameters
category (str or list) – Name(s) of category to empty, either as a simple string or a list of strings.
New in version 2.1.
-
create_horizons_category(category, domain='depth', htype='surface')[source]¶ Create one or more a Horizons category entries.
- Parameters
category (str or list) – Name(s) of category to make, either as a simple string or a list of strings.
domain (str) – ‘depth’ (default) or ‘time’
htype (str) – Horizon type: surface/lines/points
-
create_zones_category(category, domain='thickness', htype='surface')[source]¶ Create one or more a Horizons category entries.
- Parameters
category (str or list) – Name(s) of category to make, either as a simple string or a list of strings.
domain (str) – ‘thickness’ (default) or …?
htype (str) – Horizon type: surface/lines/points
-
delete_zones_category(category)[source]¶ Delete on or more horizons or zones categories. See previous
-
property
project¶ The Roxar project instance (read only)
-
rmsversion(apiversion)[source]¶ Get the actual RMS version(s) given an API version.
- Parameters
apiversion (str) – ROXAPI version to ask for
- Returns
- A list of RMS version(s) for the given API version, None if
not any match.
Example:
rox = RoxUtils(project)
rmsver = rox.rmsversion('1.5')
print('The supported RMS version are {}'.format(rmsver))
-
property
roxversion¶ Roxar API version (read only)
Metadata (experimental)
MetadataRegularSurface
-
class
xtgeo.MetaDataRegularSurface[source]¶ Bases:
xtgeo.metadata.metadata.MetaDataMetadata for RegularSurface() objects.
Docstring.
Public Data Attributes:
REQUIREDrequiredGet of set required metadata.
Inherited from
MetaDataoptionalReturn or set optional metadata.
optReturn the metadata optional instance.
freeformGet or set the current freeform metadata dictionary.
Public Methods:
Inherited from
MetaDataget_metadata()Get all metadata that are present.
generate_fmu_name()Generate FMU name on form xxxx–yyyy–date but no suffix.
-
property
freeform¶ Get or set the current freeform metadata dictionary.
-
generate_fmu_name()¶ Generate FMU name on form xxxx–yyyy–date but no suffix.
-
get_metadata()¶ Get all metadata that are present.
-
property
opt¶ Return the metadata optional instance.
This makes access to the _OptionalMetaData instance.
- Example::
>>> import xtgeo
>>> surf = xtgeo.surface_from_file(surface_dir + "/topreek_rota.gri")
>>> surf.metadata.opt.shortname = "TopValysar"
-
property
optional¶ Return or set optional metadata.
When setting optional names, it can be done in several ways…
surf.metadata.optional.name = “New name”
-
property
required¶ Get of set required metadata.
-
property
MetaDataRegularCube
-
class
xtgeo.MetaDataRegularCube[source]¶ Bases:
xtgeo.metadata.metadata.MetaDataMetadata for Cube() objects.
Docstring.
Public Data Attributes:
REQUIREDrequiredGet of set required metadata.
Inherited from
MetaDataoptionalReturn or set optional metadata.
optReturn the metadata optional instance.
freeformGet or set the current freeform metadata dictionary.
Public Methods:
Inherited from
MetaDataget_metadata()Get all metadata that are present.
generate_fmu_name()Generate FMU name on form xxxx–yyyy–date but no suffix.
-
property
freeform¶ Get or set the current freeform metadata dictionary.
-
generate_fmu_name()¶ Generate FMU name on form xxxx–yyyy–date but no suffix.
-
get_metadata()¶ Get all metadata that are present.
-
property
opt¶ Return the metadata optional instance.
This makes access to the _OptionalMetaData instance.
- Example::
>>> import xtgeo
>>> surf = xtgeo.surface_from_file(surface_dir + "/topreek_rota.gri")
>>> surf.metadata.opt.shortname = "TopValysar"
-
property
optional¶ Return or set optional metadata.
When setting optional names, it can be done in several ways…
surf.metadata.optional.name = “New name”
-
property
required¶ Get of set required metadata.
-
property
MetaDataCPGeometry
-
class
xtgeo.MetaDataCPGeometry[source]¶ Bases:
xtgeo.metadata.metadata.MetaDataMetadata for Grid() objects of type simplified CornerPoint Geometry.
Docstring.
Public Data Attributes:
REQUIREDrequiredGet of set required metadata.
Inherited from
MetaDataoptionalReturn or set optional metadata.
optReturn the metadata optional instance.
freeformGet or set the current freeform metadata dictionary.
Public Methods:
Inherited from
MetaDataget_metadata()Get all metadata that are present.
generate_fmu_name()Generate FMU name on form xxxx–yyyy–date but no suffix.
-
property
freeform¶ Get or set the current freeform metadata dictionary.
-
generate_fmu_name()¶ Generate FMU name on form xxxx–yyyy–date but no suffix.
-
get_metadata()¶ Get all metadata that are present.
-
property
opt¶ Return the metadata optional instance.
This makes access to the _OptionalMetaData instance.
- Example::
>>> import xtgeo
>>> surf = xtgeo.surface_from_file(surface_dir + "/topreek_rota.gri")
>>> surf.metadata.opt.shortname = "TopValysar"
-
property
optional¶ Return or set optional metadata.
When setting optional names, it can be done in several ways…
surf.metadata.optional.name = “New name”
-
property
required¶ Get of set required metadata.
-
property
MetaDataCPProperty
-
class
xtgeo.MetaDataCPProperty[source]¶ Bases:
xtgeo.metadata.metadata.MetaDataMetadata for GridProperty() objects belonging to CPGeometry.
Docstring.
Public Data Attributes:
REQUIREDrequiredGet of set required metadata.
Inherited from
MetaDataoptionalReturn or set optional metadata.
optReturn the metadata optional instance.
freeformGet or set the current freeform metadata dictionary.
Public Methods:
Inherited from
MetaDataget_metadata()Get all metadata that are present.
generate_fmu_name()Generate FMU name on form xxxx–yyyy–date but no suffix.
-
property
freeform¶ Get or set the current freeform metadata dictionary.
-
generate_fmu_name()¶ Generate FMU name on form xxxx–yyyy–date but no suffix.
-
get_metadata()¶ Get all metadata that are present.
-
property
opt¶ Return the metadata optional instance.
This makes access to the _OptionalMetaData instance.
- Example::
>>> import xtgeo
>>> surf = xtgeo.surface_from_file(surface_dir + "/topreek_rota.gri")
>>> surf.metadata.opt.shortname = "TopValysar"
-
property
optional¶ Return or set optional metadata.
When setting optional names, it can be done in several ways…
surf.metadata.optional.name = “New name”
-
property
required¶ Get of set required metadata.
-
property
MetaDataWell
-
class
xtgeo.MetaDataWell[source]¶ Bases:
xtgeo.metadata.metadata.MetaDataMetadata for single Well() objects.
Initialisation for Well metadata.
Public Data Attributes:
REQUIREDrequiredGet of set required metadata.
Inherited from
MetaDataoptionalReturn or set optional metadata.
optReturn the metadata optional instance.
freeformGet or set the current freeform metadata dictionary.
Public Methods:
Inherited from
MetaDataget_metadata()Get all metadata that are present.
generate_fmu_name()Generate FMU name on form xxxx–yyyy–date but no suffix.
-
property
freeform¶ Get or set the current freeform metadata dictionary.
-
generate_fmu_name()¶ Generate FMU name on form xxxx–yyyy–date but no suffix.
-
get_metadata()¶ Get all metadata that are present.
-
property
opt¶ Return the metadata optional instance.
This makes access to the _OptionalMetaData instance.
- Example::
>>> import xtgeo
>>> surf = xtgeo.surface_from_file(surface_dir + "/topreek_rota.gri")
>>> surf.metadata.opt.shortname = "TopValysar"
-
property
optional¶ Return or set optional metadata.
When setting optional names, it can be done in several ways…
surf.metadata.optional.name = “New name”
-
property
required¶ Get of set required metadata.
-
property
Plot (to be deprecated)
XSection
-
class
xtgeo.plot.XSection(zmin=0, zmax=9999, well=None, surfaces=None, sampling=20, nextend=5, colormap=None, zonelogshift=0, surfacenames=None, cube=None, grid=None, gridproperty=None, outline=None)[source]¶ Bases:
xtgeo.plot.baseplot.BasePlotClass for plotting a cross-section of a well.
- Parameters
zmin (float) – Upper level of the plot (top Y axis).
zmax (float) – Lower level of the plot (bottom Y axis).
well (Well) – XTGeo well object.
surfaces (list) – List of XTGeo RegularSurface objects
surfacenames (list) – List of surface names (str) for legend
cube (Cube) – A XTGeo Cube instance
grid (Grid) – A XTGeo Grid instance
gridproperty (GridProperty) – A XTGeo GridProperty instance
colormap (str) – Name of colormap, e.g. ‘Set1’. Default is ‘xtgeo’
outline (obj) – XTGeo Polygons object
Init method.
Public Data Attributes:
pagesizeReturns page size.
legendsizeReturns or set the legend size.
has_legendReturns or set the legends.
has_axesReturns or set the axes status.
colormap_faciesSet or get the facies colormap.
colormap_zonelogSet or get the zonelog colormap.
colormap_perfSet or get the perforations colormap.
colormap_facies_dictSet or get the facies colormap actual dict table.
colormap_perf_dictSet or get the perf colormap actual dict table.
colormap_zonelog_dictSet or get the zonelog colormap actual dict table.
fenceSet or get the fence spesification.
Inherited from
BasePlotcontourlevelsGet or set the number of contour levels.
colormapGet or set the color table as a matplot cmap object.
pagesizeReturns page size.
Public Methods:
canvas([title, subtitle, infotext, figscaling])Prepare the canvas to plot on, with title and subtitle.
plot_well([zonelogname, facieslogname, …])Input an XTGeo Well object and plot it.
set_xaxis_md([gridlines])Set x-axis labels to measured depth.
plot_cube([colormap, vmin, vmax, alpha, …])Plot a cube backdrop.
plot_grid3d([colormap, vmin, vmax, alpha, …])Plot a sampled grid with gridproperty backdrop.
plot_surfaces([fill, surfaces, …])Input a surface list (ordered from top to base) , and plot them.
plot_md_data([data, markersize, color, …])Plot MD vs TVD data as lines and/or markers.
plot_wellmap([otherwells, expand])Plot well map as local view, optionally with nearby wells.
plot_map()Plot well location map as an overall view (with field outline).
Inherited from
BasePlotdefine_any_colormap(cfile[, colorlist])Defines any color map from file or a predefined name.
get_any_colormap_as_table(cmap)Returns the given color map cmap as a list of RGB tuples.
get_colormap_as_table()Get the current color map as a list of RGB tuples.
define_colormap(cfile[, colorlist])Defines a color map from file or a predefined name.
canvas([title, subtitle, infotext, figscaling])Prepare the canvas to plot on, with title and subtitle.
show()Call to matplotlib.pyplot show method.
close()Explicitly closes the plot, meaning that memory will be cleared.
savefig(filename[, fformat, last])Call to matplotlib.pyplot savefig method.
-
__init__(zmin=0, zmax=9999, well=None, surfaces=None, sampling=20, nextend=5, colormap=None, zonelogshift=0, surfacenames=None, cube=None, grid=None, gridproperty=None, outline=None)[source]¶ Init method.
-
canvas(title=None, subtitle=None, infotext=None, figscaling=1.0)[source]¶ Prepare the canvas to plot on, with title and subtitle.
- Parameters
title (str, optional) – Title of plot.
subtitle (str, optional) – Sub title of plot.
infotext (str, optional) – Text to be written as info string.
figscaling (str, optional) – Figure scaling, default is 1.0
-
close()¶ Explicitly closes the plot, meaning that memory will be cleared.
After close is called, no more operations can be performed on the plot.
-
property
colormap¶ Get or set the color table as a matplot cmap object.
-
property
colormap_facies¶ Set or get the facies colormap.
-
property
colormap_facies_dict¶ Set or get the facies colormap actual dict table.
-
property
colormap_perf¶ Set or get the perforations colormap.
-
property
colormap_perf_dict¶ Set or get the perf colormap actual dict table.
-
property
colormap_zonelog¶ Set or get the zonelog colormap.
-
property
colormap_zonelog_dict¶ Set or get the zonelog colormap actual dict table.
-
property
contourlevels¶ Get or set the number of contour levels.
-
static
define_any_colormap(cfile, colorlist=None)¶ Defines any color map from file or a predefined name.
This is a static method, which returns a matplotlib CM object.
- Parameters
cfile (str) – File name (RMS format) or an alias for a predefined map name, e.g. ‘xtgeo’, or one of matplotlibs numerous tables.
colorlist (list, int, optional) – List of integers redefining color entries per zone and/or well, which starts from 0 index. Default is just keep the linear sequence as is.
-
define_colormap(cfile, colorlist=None)¶ Defines a color map from file or a predefined name.
- Parameters
cfile (str) – File name (RMS format) or an alias for a predefined map name, e.g. ‘xtgeo’, or one of matplotlibs numerous tables.
colorlist (list, int, optional) – List of integers redefining color entries per zone and/or well, which starts from 0 index. Default is just keep the linear sequence as is.
-
property
fence¶ Set or get the fence spesification.
-
static
get_any_colormap_as_table(cmap)¶ Returns the given color map cmap as a list of RGB tuples.
-
get_colormap_as_table()¶ Get the current color map as a list of RGB tuples.
-
property
has_axes¶ Returns or set the axes status.
-
property
has_legend¶ Returns or set the legends.
-
property
legendsize¶ Returns or set the legend size.
-
property
pagesize¶ Returns page size.
-
plot_cube(colormap='seismic', vmin=None, vmax=None, alpha=0.7, interpolation='gaussian', sampling='nearest')[source]¶ Plot a cube backdrop.
- Parameters
colormap (ColorMap) – Name of color map (default ‘seismic’)
vmin (float) – Minimum value in plot.
vmax (float) –
alpha (float) – Alpah blending number beween 0 and 1.
interpolation (str) – Interpolation for plotting, cf. matplotlib documentation on this. Also gaussianN is allowed, where N = 1..9.
sampling (str) – ‘nearest’ (default) or ‘trilinear’ (more precise)
- Raises
ValueError – No cube is loaded
-
plot_grid3d(colormap='rainbow', vmin=None, vmax=None, alpha=0.7, zinc=0.5, interpolation='auto')[source]¶ Plot a sampled grid with gridproperty backdrop.
- Parameters
colormap (ColorMap) – Name of color map (default ‘rainbow’)
vmin (float) – Minimum value in plot.
vmax (float) –
alpha (float) – Alpha blending number beween 0 and 1.
zinc (float) – Sampling vertically, default is 0.5
interpolation (str) – Interpolation for plotting, cf. matplotlib documentation on this. “auto” uses “nearest” for discrete parameters and “antialiased” for floats.
- Raises
ValueError – No grid or gridproperty is loaded
-
plot_md_data(data=None, markersize=10, color='red', linestyle='', label=False, zorder=350, **kwargs)[source]¶ Plot MD vs TVD data as lines and/or markers.
The input pandas dataframe points shall have the following columns: * Name of well(s) named WELL * Coordinate X named MDEPTH * Coordinate Y named Z_TVDSS
-
plot_surfaces(fill=False, surfaces=None, surfacenames=None, colormap=None, onecolor=None, linewidth=1.0, linestyle='-', legend=True, legendtitle=None, fancyline=False, axisname='main', gridlines=False)[source]¶ Input a surface list (ordered from top to base) , and plot them.
-
plot_well(zonelogname='ZONELOG', facieslogname=None, perflogname=None, wellcrossings=None, wellcrossingnames=True, wellcrossingyears=False, welltrajcolor='black', welltrajwidth=6)[source]¶ Input an XTGeo Well object and plot it.
-
plot_wellmap(otherwells=None, expand=1)[source]¶ Plot well map as local view, optionally with nearby wells.
- Parameters
otherwells (list of Polygons) – List of surrounding wells to plot, these wells are repr as Polygons instances, one per well.
expand (float) – Plot axis expand factor (default is 1); larger values may be used if other wells are plotted.
-
savefig(filename, fformat='png', last=True, **kwargs)¶ Call to matplotlib.pyplot savefig method.
- Parameters
filename (str) – File to plot to
fformat (str) – Plot format, e.g. png (default), jpg, svg
last (bool) – Default is true, calls close on the plot, let last be False for all except the last plots.
kwargs – Additional keyword arguments that are passed to matplotlib when saving the figure
- Returns
True of plotting is done; otherwise False
Example:
myplot.savefig('layerslice.svg', fformat='svg', last=False)
myplot.savefig('layerslice.png')
Changed in version 2.4: added kwargs option
-
show()¶ Call to matplotlib.pyplot show method.
- Returns
True of plotting is done; otherwise False
Map
-
class
xtgeo.plot.Map[source]¶ Bases:
xtgeo.plot.baseplot.BasePlotClass for plotting a map, using matplotlib.
The constructor method for a Map object.
Public Data Attributes:
pagesizeReturns page size.
Inherited from
BasePlotcontourlevelsGet or set the number of contour levels.
colormapGet or set the color table as a matplot cmap object.
pagesizeReturns page size.
Public Methods:
plot_surface(surf[, minvalue, maxvalue, …])Input a surface and plot it.
plot_faults(fpoly[, idname, color, …])Plot the faults.
plot_polygons(fpoly[, idname, color, linewidth])Plot a polygons instance.
plot_points(points)Plot a points set on the map.
plot_wells(wells)Plot wells on the map.
Inherited from
BasePlotdefine_any_colormap(cfile[, colorlist])Defines any color map from file or a predefined name.
get_any_colormap_as_table(cmap)Returns the given color map cmap as a list of RGB tuples.
get_colormap_as_table()Get the current color map as a list of RGB tuples.
define_colormap(cfile[, colorlist])Defines a color map from file or a predefined name.
canvas([title, subtitle, infotext, figscaling])Prepare the canvas to plot on, with title and subtitle.
show()Call to matplotlib.pyplot show method.
close()Explicitly closes the plot, meaning that memory will be cleared.
savefig(filename[, fformat, last])Call to matplotlib.pyplot savefig method.
-
canvas(title=None, subtitle=None, infotext=None, figscaling=1.0)¶ Prepare the canvas to plot on, with title and subtitle.
- Parameters
title (str, optional) – Title of plot.
subtitle (str, optional) – Sub title of plot.
infotext (str, optional) – Text to be written as info string.
figscaling (str, optional) – Figure scaling, default is 1.0
-
close()¶ Explicitly closes the plot, meaning that memory will be cleared.
After close is called, no more operations can be performed on the plot.
-
property
colormap¶ Get or set the color table as a matplot cmap object.
-
property
contourlevels¶ Get or set the number of contour levels.
-
static
define_any_colormap(cfile, colorlist=None)¶ Defines any color map from file or a predefined name.
This is a static method, which returns a matplotlib CM object.
- Parameters
cfile (str) – File name (RMS format) or an alias for a predefined map name, e.g. ‘xtgeo’, or one of matplotlibs numerous tables.
colorlist (list, int, optional) – List of integers redefining color entries per zone and/or well, which starts from 0 index. Default is just keep the linear sequence as is.
-
define_colormap(cfile, colorlist=None)¶ Defines a color map from file or a predefined name.
- Parameters
cfile (str) – File name (RMS format) or an alias for a predefined map name, e.g. ‘xtgeo’, or one of matplotlibs numerous tables.
colorlist (list, int, optional) – List of integers redefining color entries per zone and/or well, which starts from 0 index. Default is just keep the linear sequence as is.
-
static
get_any_colormap_as_table(cmap)¶ Returns the given color map cmap as a list of RGB tuples.
-
get_colormap_as_table()¶ Get the current color map as a list of RGB tuples.
-
property
pagesize¶ Returns page size.
-
plot_faults(fpoly, idname='POLY_ID', color='k', edgecolor='k', alpha=0.7, linewidth=0.8)[source]¶ Plot the faults.
- Parameters
fpoly (object) – A XTGeo Polygons object
idname (str) – Name of column which has the faults ID
color (c) – Fill color model c according to Matplotlib
edgecolor (c) – Edge color according to Matplotlib
alpha (float) – Degree of opacity
linewidth (float) – Line width
-
plot_points(points)[source]¶ Plot a points set on the map.
This can be be useful e.g. for plotting the underlying point set that makes a gridded map.
- Parameters
points (Points) – A XTGeo Points object X Y VALUE
-
plot_polygons(fpoly, idname='POLY_ID', color='k', linewidth=0.8)[source]¶ Plot a polygons instance.
- Parameters
fpoly (object) – A XTGeo Polygons object
idname (str) – Name of column which has the faults ID
color (c) – Line color model c according to Matplotlib
linewidth (float) – Line width
-
plot_surface(surf, minvalue=None, maxvalue=None, contourlevels=None, xlabelrotation=None, colormap=None, logarithmic=False)[source]¶ Input a surface and plot it.
-
plot_wells(wells)[source]¶ Plot wells on the map.
- Parameters
wells (Wells) – A XTGeo Wells object (contains a number of Well instances).
-
savefig(filename, fformat='png', last=True, **kwargs)¶ Call to matplotlib.pyplot savefig method.
- Parameters
filename (str) – File to plot to
fformat (str) – Plot format, e.g. png (default), jpg, svg
last (bool) – Default is true, calls close on the plot, let last be False for all except the last plots.
kwargs – Additional keyword arguments that are passed to matplotlib when saving the figure
- Returns
True of plotting is done; otherwise False
Example:
myplot.savefig('layerslice.svg', fformat='svg', last=False)
myplot.savefig('layerslice.png')
Changed in version 2.4: added kwargs option
-
show()¶ Call to matplotlib.pyplot show method.
- Returns
True of plotting is done; otherwise False
-
Grid3DSlice
-
class
xtgeo.plot.Grid3DSlice[source]¶ Bases:
xtgeo.plot.baseplot.BasePlotClass for plotting a row, a column, or a layer, using matplotlib.
Construct an instance for a Grid3DSlice object.
Public Data Attributes:
Inherited from
BasePlotcontourlevelsGet or set the number of contour levels.
colormapGet or set the color table as a matplot cmap object.
pagesizeReturns page size.
Public Methods:
plot_gridslice(grid[, prop, mode, minvalue, …])Plot a row slice, column slice or layer slice of a grid.
Inherited from
BasePlotdefine_any_colormap(cfile[, colorlist])Defines any color map from file or a predefined name.
get_any_colormap_as_table(cmap)Returns the given color map cmap as a list of RGB tuples.
get_colormap_as_table()Get the current color map as a list of RGB tuples.
define_colormap(cfile[, colorlist])Defines a color map from file or a predefined name.
canvas([title, subtitle, infotext, figscaling])Prepare the canvas to plot on, with title and subtitle.
show()Call to matplotlib.pyplot show method.
close()Explicitly closes the plot, meaning that memory will be cleared.
savefig(filename[, fformat, last])Call to matplotlib.pyplot savefig method.
-
canvas(title=None, subtitle=None, infotext=None, figscaling=1.0)¶ Prepare the canvas to plot on, with title and subtitle.
- Parameters
title (str, optional) – Title of plot.
subtitle (str, optional) – Sub title of plot.
infotext (str, optional) – Text to be written as info string.
figscaling (str, optional) – Figure scaling, default is 1.0
-
close()¶ Explicitly closes the plot, meaning that memory will be cleared.
After close is called, no more operations can be performed on the plot.
-
property
colormap¶ Get or set the color table as a matplot cmap object.
-
property
contourlevels¶ Get or set the number of contour levels.
-
static
define_any_colormap(cfile, colorlist=None)¶ Defines any color map from file or a predefined name.
This is a static method, which returns a matplotlib CM object.
- Parameters
cfile (str) – File name (RMS format) or an alias for a predefined map name, e.g. ‘xtgeo’, or one of matplotlibs numerous tables.
colorlist (list, int, optional) – List of integers redefining color entries per zone and/or well, which starts from 0 index. Default is just keep the linear sequence as is.
-
define_colormap(cfile, colorlist=None)¶ Defines a color map from file or a predefined name.
- Parameters
cfile (str) – File name (RMS format) or an alias for a predefined map name, e.g. ‘xtgeo’, or one of matplotlibs numerous tables.
colorlist (list, int, optional) – List of integers redefining color entries per zone and/or well, which starts from 0 index. Default is just keep the linear sequence as is.
-
static
get_any_colormap_as_table(cmap)¶ Returns the given color map cmap as a list of RGB tuples.
-
get_colormap_as_table()¶ Get the current color map as a list of RGB tuples.
-
property
pagesize¶ Returns page size.
-
plot_gridslice(grid, prop=None, mode='layer', minvalue=None, maxvalue=None, colormap=None, linecolor='black', index=1, window=None, activeonly=True)[source]¶ Plot a row slice, column slice or layer slice of a grid.
- Parameters
grid (Grid) – The XTGeo grid object
prop (GridProperty, optional) – The XTGeo grid property object
mode (str) – Choose between ‘column’, ‘row’, ‘layer’ (default)
minvalue (float) – Minimum level color scale (default: from data)
maxvalue (float) – Maximum level color scale (default: from data)
index (int) – Index to plot e.g layer number if layer slice (first=1)
colormap – Color map to use for cells, e.g. ‘rainbow’ or an rmscol file
linecolor (str or tuple) – Color of grid lines (black/white/grey or a tuple with 4 numbers on valid matplotlib format)
activeonly (bool) – If only use active cells
window (str) – Some window
-
savefig(filename, fformat='png', last=True, **kwargs)¶ Call to matplotlib.pyplot savefig method.
- Parameters
filename (str) – File to plot to
fformat (str) – Plot format, e.g. png (default), jpg, svg
last (bool) – Default is true, calls close on the plot, let last be False for all except the last plots.
kwargs – Additional keyword arguments that are passed to matplotlib when saving the figure
- Returns
True of plotting is done; otherwise False
Example:
myplot.savefig('layerslice.svg', fformat='svg', last=False)
myplot.savefig('layerslice.png')
Changed in version 2.4: added kwargs option
-
show()¶ Call to matplotlib.pyplot show method.
- Returns
True of plotting is done; otherwise False
-